Agricultural and Biological Research
RNI # 24/103/2012-R1
Research Article - (2024) Volume 40, Issue 1
Periphyton are ecological attribute when bioindicator for biological assessment of environment stress and human impact in aquatic ecosystem. Four sampling sites were selected from a river and sample collected in summer season (April, May and June). Monthly variation of Water quality parameter such as pH, Temperature, Turbidity, DO, BOD, Phosphate, Nitrate and TDS, Biological parameter (AFDW and Chlorophyll-a) and periphyton composition are found. Examination of the Periphytic algal groups of Yamuna were represented by 20 taxa which had a place with 4 noteworthy classes in particular Bacillariophyceae (13), Chlorophyceae (3), Cascinodiscophyceae (1) and Cyanophyceae (3). Hence, an endeavour was made to evaluate water pollution in the Yamuna River by utilizing periphyton productivity, measured in terms of biomass Ash-Free Dry Weight (AFDW), and chlorophyll-a content. The comprehensive analysis, considering all parameters, concluded that all the stations exhibited minimal pollution effects. Therefore, it was not universally applicable that an increase in biomass AFDW, resulting from nutrient enrichment, would invariably lead to an increase in chlorophyll-a in accumulated periphyton. The study highlighted the varied effects of increased nutrients in river water, demonstrating the seasonality and species specificity of periphyton biomass influenced by seasonal changes and eutrophication. Additionally, the research emphasized the independent variable observed during summer seasons.
Ash free dry weight; Bacillariophyceae; Chlorophyceae; Cascinodiscophyceae; Cyanophyceae; Chlorophyll-a; Periphyton
Periphyton represents a highly diverse assemblage of freshwater benthic organisms, predominantly composed of photoautotrophic microorganisms such as diatoms, green algae, and cyanobacteria [1]. Serving as the cornerstone of aquatic food webs, periphyton functions as primary producers, playing a crucial role in oxygen release and influencing water mass dynamics [2,3]. Because of its ecological importance in the functioning of waterways, periphyton is widely used as a biotic communal model to assess the effects of biotic and abiotic factors, such as nutrient interactions, anthropogenic chemical pollution or eutrophication [4]. The rapid development of agriculture and industrialization has led to the delivery of large amounts of nutrients, especially Nitrogen (N) and Phosphorus (P), into aquatic environments [5]. This is suggested that changing temperature and nutrient availability will alter ecosystem structure and subsequently impend the ecological functioning of shallow lakes has been extensively explored [6,7]. It is widely acknowledged that submerged macrophytes play a vital role in maintaining water clarity by regulating nutrient retention and cycling in aquatic ecosystems [8,9]. Concurrently, elevated temperatures can expedite dissimilation processes such as respiration and senescence. When dissimilation surpasses assimilation, there is a consequent decline in the biomass of submerged macrophytes [10,11].
While submerged macrophytes can uptake Nitrogen (N) and Phosphorus (P) from the water column, meeting metabolic demands and promoting plant growth [12,13]; the combined influence of temperature and nutrients may regulate their growth through an indirect pathway. This involves elevated temperature and nutrient enrichment inducing environmental stress, leading to a decline in submerged macrophyte biomass. Moreover, the interplay of rising temperature and nutrient enrichment may alter abiotic variables like Dissolved Oxygen (DO) and pH. These changes, in turn, impact submerged macrophytes, as DO is essential for respiration, and pH governs the availability of inorganic Carbon (C) for these macrophytes [14,15]. Conversely, temperature and nutrients can affect submerged macrophytes by influencing biological variables such as phytoplankton, ectophyte, and zooplankton biomass. Stress at both the same trophic level and higher trophic levels poses a threat to the growth of submerged macrophytes [16,17].
Study area
The study area is located in Prayagraj city. It is located subtropical region with extreme winter and summer. Temperature rises up to 48°C during summer and goes below 5°C in winter season of Prayagraj district vary minimum in the month of December to January and maximum in end of May and June.
Sampling sites
Bargad Ghat (25°41’95” 81°82’81”), Gau ghat (25°43’08” 81°84’65”), New bridge (25°42’65” 81°86’13”) and Sarswati ghat (25°43’58” 81°84’63”) are sampling sites.
Sample collection
The water samples were collected from all the four sampling stations established in Yamuna River in summer seasons (April, May and June). Monthly subsurface water samples were meticulously collected during the early hours (7 am to 11 am) to ensure accuracy. Great care was exercised to prevent water spillage and air bubbling during sample collection. All physico-chemical water characteristics were analyzed in the Environmental Science laboratory at SHUATS.
Periphyton sampling and identification
During the summer seasons, periphyton samples were gathered at all four stations. Collection involved obtaining samples from 1-2 square centimetre surface areas of submerged stones, wood, and old logs in the flowing water. These samples were promptly preserved in 80 ml of a 4-5% formalin solution for species identification. To the extent possible, the colonized periphyton were identified at the species level, primarily under oil immersion (× 1000 magnification). This identification process utilized taxonomic keys, drawings, and descriptions from references such as Kelly [15], EN14407 [18], Matsuzaki et al., [19], Sarwar et al., [20].
The outcomes pertaining to river water quality parameters are presented in Table 1, illustrating the monthly variation in physico-chemical characteristics.
| Parameters | Site I | Site II | Site III | Site IV | ||||||||
|---|---|---|---|---|---|---|---|---|---|---|---|---|
| April | May | June | April | May | June | April | May | June | April | May | June | |
| pH | 7.8 | 7.6 | 7.9 | 8.4 | 7.9 | 7.8 | 7.9 | 8.2 | 8.1 | 7.8 | 8 | 8.6 |
| Temperature | 20 | 21.5 | 22 | 20.5 | 22.5 | 23 | 20.5 | 21.5 | 23.5 | 21 | 21.5 | 23 |
| Turbidity | 39.72 | 20 | 17.74 | 37.69 | 20.3 | 15.19 | 29.31 | 19.9 | 16.65 | 35.64 | 30.03 | 19.16 |
| DO | 6.7 | 5.3 | 5.1 | 6.5 | 5.3 | 5.3 | 8.1 | 5.5 | 5.4 | 8.2 | 5.5 | 5.3 |
| BOD | 1.3 | 1.1 | 1.1 | 1.5 | 1 | 1.1 | 2.1 | 1.3 | 0.9 | 1.8 | 1.3 | 1.1 |
| Phosphate | 1 | 1.1 | 1.4 | 1 | 1.3 | 1.8 | 1.8 | 2.1 | 1.7 | 1.6 | 1.1 | 1.4 |
| Nitrate | 1.5 | 0.8 | 1.8 | 1.5 | 1.7 | 1.1 | 1.8 | 2.1 | 1.6 | 1.8 | 1.3 | 1.8 |
| TDS | 267.33 | 254 | 212.67 | 190.67 | 188 | 179 | 185.33 | 180.33 | 172.67 | 235.33 | 201.67 | 190.67 |
Table 1: Water quality parameters of Yamuna River water at selected stations.
Regarding the monthly pH variations in water analysis, the lowest pH of 7.6 was observed in May at station-I, while the highest pH of 8.6 occurred in June at station-IV. The pH values were notably influenced during the winter season due to heavy rainfall and dilution effects. A similar observation was reported by Saksena et al., [21]. Ellis [22] noted that a pH range of 6.7 to 8.4 is conducive to the development of aquatic biota [23].
In the analysis of stream water temperature variation, the minimum value of 20°C was recorded at station I in April, while the maximum value of 23.5°C occurred at station-III in June. Lower water temperatures were documented in winter, whereas the highest temperatures were recorded in summer. Comparable seasonal temperature variations in water were documented by Seth et al., [5] in the Ghaghara River and in the Yamuna River [21,23].
The monthly variation of Turbidity in waterway minimum turbidity (15.19 NTU) at the station-II in the month of June and maximum worth (39.72 NTU) was recorded at Site I in the month of April. The result showed similarity with the finding of Romani et al., [24] in Chambal River in Ground water and Ajibade et al., [25] in Lake national park.
The DO value focus in stream water the minimum dissolved oxygen was recorded as 5.1 mgl-1 at Site I in the month of June while greatest dissolved oxygen was 8.2 mgl-1 at Site IV in the month of April. From storm season the water of Ganga begins getting to be turbid which lessens the photosynthetic action of the green growth and subsequently diminishes oxygen concentration [26].
The Biological Oxygen Demand (BOD), an indicator of contamination, exhibited variations in River water, ranging from 0.9 mg/L at Site III in June to 2.1 mg/L at the same site in April. The organic matter content was at its minimum during summer and peaked in winter. The lowest BOD values occurred in winter, attributed to the decrease in temperature suppressing microbial activity and algal bloom. This observation aligns with findings by Singh et al., [27] in studies conducted on the Ganga and Yamuna Rivers (Figure 1).
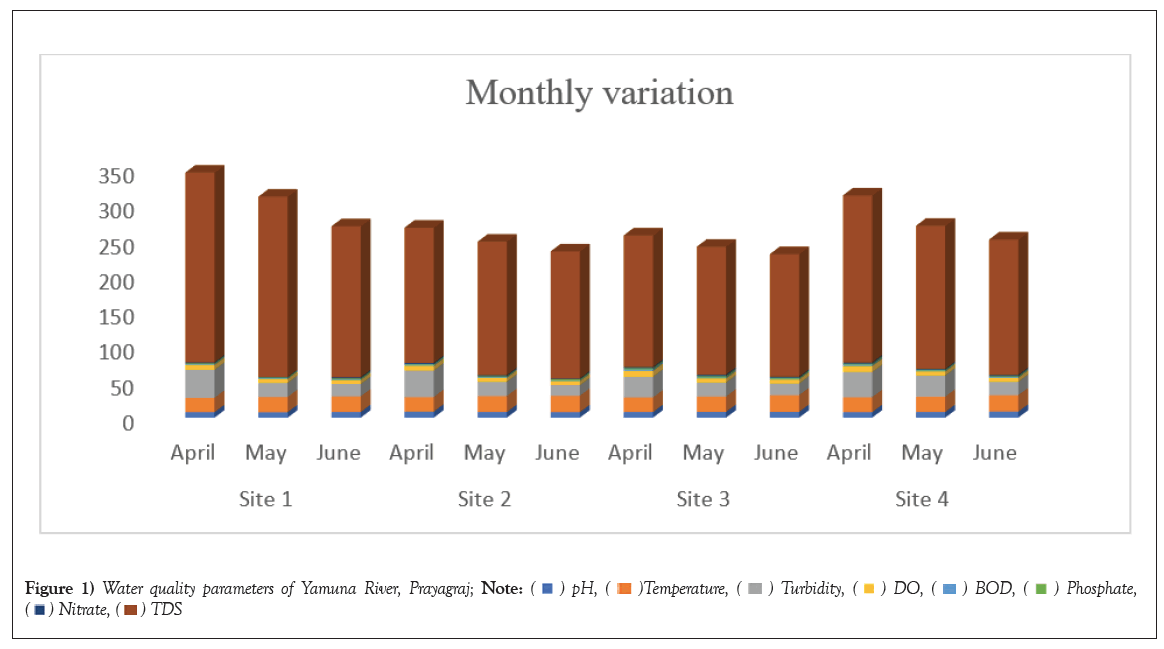
Figure 1: Water quality parameters of Yamuna River, Prayagraj; 
 .
.
The variation of phosphate focus in stream water ranged was recorded from 1 mgl-1 at Site I and II in the month of April to 2.1 mgl-1 at Site III in the month of May. Singh et al., [27] have reported higher phosphate content in lower stretch of Ganga River during monsoon season. High phosphate fixation demonstrates compost overflow, household waste release and cleansers. Comparative perceptions were additionally made by Khare et al., [28]. Phosphorus stacking to streams can build the biomass of periphyton, macroalgae, and sestonic green growth, as measured by chl-a [21,23,29].
In the stream under study, the variation of nitrate fixation in waterway water ranged from 0.8 mgl-1 at Site I in the month of May to 2.1 mgl-1 at Site III in the month of May was recorded. Nitrate-N was observed to be entirely low amid the present examination which mirrors that the stream does not get any waste water. Nitrate focus relies on the movement of nitrifying microscopic organisms [23].
The monthly variation of TDS was recorded minimum value (179 mgl-1) at the station-II in the month of June and maximum TDS value (267.33 mgl-1) was recorded at Site I in the month of April. High TDS influence the other qualities of water such as taste, hardness, corrosion properties, influences osmoregulation of fresh water organism, and they are not generally removed by conventional method and finally reduce utility of water for drinking and irrigation purposes [5].
Periphyton species composition
The present study revealed that periphyton mainly consisted of algal components in this tributary and was composed of Bacillariophyceae, Chlorophyceae, Cascinodiscophyceae and Cyanophyceae. During the study period 20 different genera of periphyton groups were recorded. Among these, class Chlorophyceae was represented by 3 genera, Bacillariophyceae were represented by 13 genera, Cascinodiscophyceae was represented by 1 genus and Cyanophyceae was represented by 3 genera. The most well-known periphytic species experienced over each of the four destinations included Chaetophora, Cloneis, Diatima, Navicula, Synedra, Oscillatoria and Nitzchia sp. The collected periphyton from the four different stations are depicted in Table 2. Bacillariophyceae were observed to be dominant group (65%) and Cascinodiscophyceae as the gathering with least abundance (5%) through the study period. There were 16 genera of periphyton found in Station-1, 13 genera in Station-2, 10 genera in Station-3 and 13 genera in Station-4. Among these stations Station-1 contributes dominant generic composition (31%) and station-3 were slightest contributes generic composition (19%) (Figures 2 and 3).
| Classes | Genera | S1 | S2 | S3 | S4 |
|---|---|---|---|---|---|
| Bascillariophyceae | Achnonthidium sp. | + | + | - | - |
| Amphora sp. | + | - | - | + | |
| Cymbella sp. | - | + | + | + | |
| Cylidrothece sp. | - | + | - | - | |
| Cymbopleura sp. | + | - | - | - | |
| Diatoma sp. | + | + | + | + | |
| Fragilaria sp. | + | + | - | + | |
| Gyrosigma sp. | + | - | + | - | |
| Navicula sp. | + | + | + | + | |
| Nitzchia sp. | + | + | + | + | |
| Pinnnularia sp. | + | + | - | - | |
| Surirella sp. | + | - | - | + | |
| Syndera sp. | + | + | + | + | |
| Cascinodiscophyceae | Coscindiscus sp. | + | - | - | - |
| Melosira sp. | - | - | - | - | |
| Cyanophyceae | Calothrix sp. | - | - | - | + |
| Oscillatoria sp. | + | + | + | + | |
| Lynghya sp. | - | + | - | - | |
| Chlorophyceae | Carteria sp. | + | - | + | + |
| Chaetophora sp. | + | + | + | + | |
| Cloneis sp. | + | + | + | + |
Note: + present, - Absent; S= station.
Table 2: Distribution of periphyton composition in Yamuna River, summer seasons.
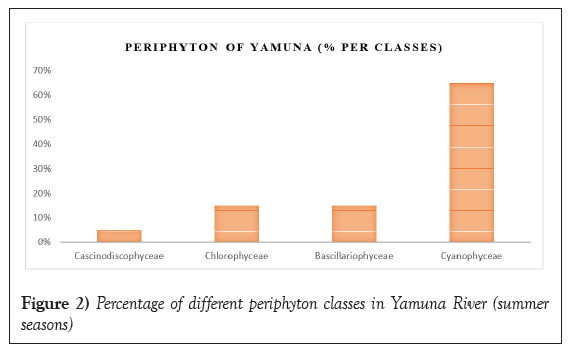
Figure 2: Percentage of different periphyton classes in Yamuna River (summer seasons).
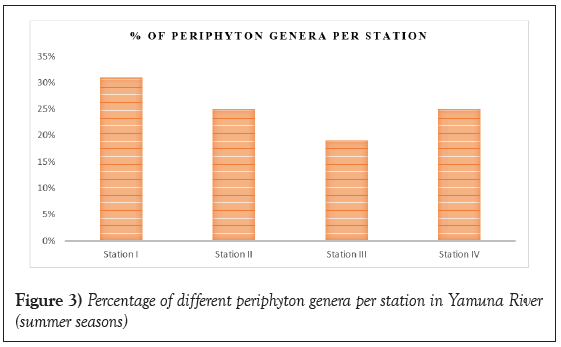
Figure 3: Percentage of different periphyton genera per station in Yamuna River (summer seasons).
Periphyton biomass and chlorophyll-a content
Periphyton biomass, quantified in Ash-Free Dry Weight (AFDW), exhibited distinct patterns across all four stations. Notably, lower values consistently characterized the unpolluted Station 3 (mean 7286.11 mg/m²), followed by the slightly polluted Station 4 (mean 9663.44 mg/m²), the polluted Station 1 (mean 9668.33 mg/m²), and the highly polluted Station 2 (mean 10587.78 mg/m²). Station 2 consistently displayed elevated biomass AFDW, accompanied by the highest ash content (Table 3 and Figure 4). The heightened biomass AFDW at the downstream reach of Station 2 in the Yamuna River was attributed to increased nutrient enrichment resulting from sewage and other organic pollutants. Interestingly, despite being based on biomass accumulation in terms of AFDW, both the slightly polluted Station 4 and the contaminated Station 1 exhibited slightly higher values than the unpolluted Station 3. Temporal variations at these stations were somewhat similar throughout the sampling period, in contrast to the highly polluted Station 2, which demonstrated wider temporal fluctuations during the summer season investigation.
| No. of days | Biomass ash-free dry weight | |||
|---|---|---|---|---|
| S1 | S2 | S3 | S4 | |
| 42 | 9874 | 10100.33 | 4324 | 14234 |
| 21 | 15675 | 9676 | 9878.33 | 7655 |
| 23 | 3456 | 11987 | 7656 | 5901.33 |
| Mean | 9668.33 | 10587.78 | 7286.11 | 9663.44 |
Table 3: Biomass AFDW (mg/m²) of periphyton in summer seasons.

Figure 4: Biomass AFDW (mg/m²) of periphyton, summer seasons; 

 .
.
Periphyton production, as indicated by chlorophyll-a content measured across all four stations, revealed mean values of 51.49 mg/m² at the unpolluted Station 3, 109.06 mg/m² at the slightly polluted Station 4, 110.97 mg/m² at the polluted Station 2, and 136.11 mg/m² at the highly polluted Station 1 (Table 4 and Figure 5). Interestingly, chlorophyll-a values consistently exhibited higher readings at the unpolluted Station 3 compared to the slightly polluted Station 4 and the polluted Station 2, even though Station 2 displayed higher biomass AFDW compared to Station 1. Both Stations 3 and 4 demonstrated a similar pattern of temporal variation during the study period. The highly polluted Station 1 consistently displayed higher chlorophyll-a content, albeit with wider temporal fluctuations compared to the unpolluted Station 3, slightly polluted Station 4, and polluted Station 2. This pattern mirrored the observations made for biomass AFDW values obtained at Station 1.
| Month | Chlorophyll-a | |||
|---|---|---|---|---|
| S1 | S2 | S3 | S4 | |
| April | 134.33 | 131 | 52.13 | 113.03 |
| May | 141.67 | 118.9 | 56 | 106 |
| June | 132.33 | 83.01 | 46.34 | 108.17 |
| Mean | 136.11 | 110.97 | 51.49 | 109.06 |
Table 4: Chlorophyll-a (mg/m²) of periphyton in summer seasons.
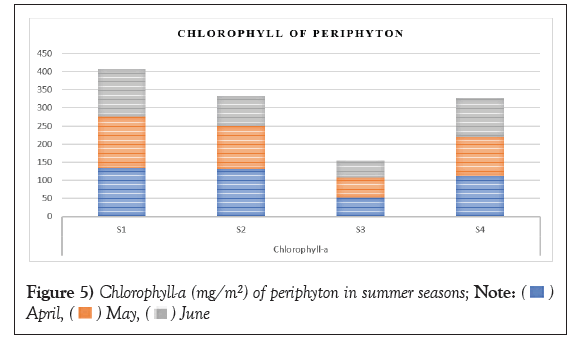
Figure 5: Chlorophyll-a (mg/m²) of periphyton in summer seasons; 
 .
.
The expanded preparations of periphyton, as far as both biomass AFDW and chlorophyll-a at the exceptionally contaminated Station 1 (as contrasted with Stations 3 and 4), was because of expanded development of contamination tolerant filamentous green growth and also diatoms. However, the aggregate number of diatom species recorded at Station 1 was low contrasted with Stations 3 and 4 [2,30]. Station 3, with the most reduced mean biomass AFDW, demonstrated higher chlorophyll-a substance than that of Station 4. This brought about more prominent biomass over chlorophyll-a substance at downstream somewhat contaminated Station 4. Ho [31] likewise announced that connections between color substance, biomass and profitability were from time to time steady. They may change contingent on species included, physiological condition of the group and ecological conditions, for example, light and temperature [32,33]. Conversely, Grzenda et al., [34], Cushing [35] detailed a noteworthy relationship between chlorophyll-a and biomass AFDW. Periphytic chl-a in our examination was most noteworthy amid times of low stable stream in summer and fall; however, periphyton happened reliably in just two of the five streams. Biomass expanded idea the winter season with most extreme rate of increment recorded amid November-December. The spring increment in the biomass is additionally because of the mass development of reasonable substrates for periphyton and the wealth of accessible supplements. The midyear decay is connected with diminished rates of populace thickness [36-40].
Assessment result showed that higher value of pH, DO and BOD at all station. Turbidity, DO, BOD, it presents the pollution group possibly due to human origin including untreated and partially treated discharges. The mineral component of the river Yamuna water and mix pollution source are due to turbidity and pH. The Periphytic algal assemble of Yamuna were spoken to by 20 taxa which had a place with 4 important classes specifically Bacillariophyceae (13), Chlorophyceae (3), Cascinodiscophyceae (1) and Cyanophyceae (3). The most generally perceived periphytic species experienced over each one of the four goals included Carteria, Chaetophora, Cloneis, Diatima, Cymbella, Fragilaria, Navicula, Oscillatoria and Synedra sp. The total examination in light of the after effects of the considerable number of parameters reasoned that when synthetic parameters and biomass fiery debris free dry weight, chlorophyll-an (organic parameters) were analyzed inside Station 3, Station 4 and station 2, next to no relationship was found between them aside from all parameters. The connection between some synthetic and the biomass AFDW, chlorophyll-a was more articulated at exceptionally contaminated Station 1.
Author is thankful to my Adviser Dr. Abhishek James and working staff SHUATS University for their cooperation during the research work and also thankful to Dr. Ram Bharose, Assistant professor and head / In charge, department of Environmental science, SHUATS University for providing all necessary facilities for conducting this research work.
[Crossref] [Google Scholar] [PubMed]
[Crossref] [Google Scholar] [PubMed]
[Crossref] [Google Scholar] [PubMed]
[Crossref] [Google Scholar] [PubMed]
[Crossref] [Google Scholar] [PubMed]
[Crossref] [Google Scholar] [PubMed]
[Crossref] [Google Scholar] [PubMed]
[Google Scholar] [PubMed]
[Crossref] [Google Scholar] [PubMed]
[Crossref] [Google Scholar] [PubMed]
[Crossref] [Google Scholar] [PubMed]
Citation: Singh S, Srivastava AK, Bhandari S, et al. Bioassessment of water pollution using periphyton efficiency in summer seasons, Yamuna River, Prayagraj, India. AGBIR.2024;40(1):812-816.
Received: 05-Dec-2023, Manuscript No. AGBIR-23-122466; , Pre QC No. AGBIR-23-122466 (PQ); Editor assigned: 07-Dec-2023, Pre QC No. AGBIR-23-122466 (PQ); Reviewed: 25-Dec-2023, QC No. AGBIR-23-122466; Revised: 03-Jan-2024, Manuscript No. AGBIR-23-122466 (R); Published: 11-Jan-2024, DOI: 10.35248/0970-1907.24.40.812-816
Copyright: This open-access article is distributed under the terms of the Creative Commons Attribution Non-Commercial License (CC BY-NC) (http:// creativecommons.org/licenses/by-nc/4.0/), which permits reuse, distribution and reproduction of the article, provided that the original work is properly cited and the reuse is restricted to noncommercial purposes. For commercial reuse, contact reprints@pulsus.com This is an open access article distributed under the terms of the Creative Commons Attribution License, which permits unrestricted use, distribution, and reproduction in any medium, provided the original work is properly cited.
