An International Journal
Agricultural and Biological Research
ISSN - 0970-1907
RNI # 24/103/2012-R1
RNI # 24/103/2012-R1
Research Article - (2024) Volume 40, Issue 3
Barley (Hordeum vulgare L.) is one of the most important traditional crops in Ethiopia. According to recent research, Ethiopia is considered a center of diversity for barley due to its high levels of genetic and phenotypic diversity. Multivariate techniques such as cluster and principal component analysis are important strategies for classifying and understand genetic relationships among different genotypes. The present experiment was undertaken on forty-nine six-row advanced breeding line food barley genotypes which were conducted in seven-by-seven simple lattice design at Woreilu farmer training center, in 2021/2022 main cropping season to estimate the extent of genetic variation, clustering of food barley genotypes and identifying the important traits in genotypes. The study found that the genotypes could be grouped into five distinct clusters, with the highest inter-cluster distance being between clusters I and IV. Principal component analysis also revealed that the first four principal components explained 80.36% of the total variation. The study suggests that selecting genotypes from these two clusters for hybridization may be desirable for improving yield and other desirable characteristics. However, the study was conducted for only one growing season and further testing in different locations for more than one cropping season is necessary.
Clustering; Genetic divergence; Principal component analysis; Genotypes
Barley (Hordeum vulgare L.) is one of the most important traditional crops. It is commonly cultivated in marginal areas where the production of other cereals is limited [1]. Ethiopia is considered as the center of diversity for barley (Hordeum vulgare L.) due to the presence of high levels of genetic and phenotypic diversity [2]. In Ethiopia during 2019/2020 cropping season barley was the 5th cereal crop next to teff, maize, sorghum and wheat both in terms of area coverage and production.
Barley is used as a food and beverage in more than 20 different ways in the country. Bread and Injera (pancake-like bread) are among the major types of barley products to consume. Roasted or cooked grain is also consumed alone or mixed with beans and peas. The powder is made to porridge either boiled or raw. Kinche (a type of bulgur) is another type of food prepared from semimilled grains of barley [3].
Ethiopian Biodiversity Institute has collected around 17,000 accessions from the barley-growing regions of the country and these accessions cover a vast range of agro ecological conditions and are safely conserved in the national gene bank, which is a great initiative for the preservation of biodiversity [4]. Even though the collections are numerous with various characteristics that may be different or interrelated, the magnitude of the variation is not yet properly studied and documented. Therefore, grouping the existed genotypes based on morphological characters enables breeder to exploit existed genetic resources for further breeding programs.
Breeding for grain yield improvement is dependent on the presence of genetic diversity which is an important factor in any hybridization program. Methodologies useful in diversity studies, including multivariate procedures (cluster analysis, principal component analysis). Multivariate analysis refers to all statistical methods that simultaneously analyze multiple measurements of each individual or object under investigation. More explicitly, any analysis of more than two variables can be considered as multivariate analysis [5]. The use of multivariate techniques is an important strategy for germplasm classification and the study of genetic relationships among genotypes [6,7]. The multivariate analysis of quantitative traits has been widely used in several crop species for predicting genetic diversity [6,8]. Cluster analysis is used to summarize information on relationships between objects by grouping similar units so that the relationships may be easily understood and communicated. Cluster analysis is a multivariate analysis and it is widely used to describe genetic diversity based on similarities or differences among genotypes [9]. PCA eliminates redundancy in data sets and gives the reliable patterns of distribution. Principal Component Analysis (PCA) has been widely used in plant sciences for the reduction of variables and grouping of genotypes. Eticha et al., [6] and Vikender et al., [8] used PCA and cluster analysis to group Eragrostis tef (Zucc.) germplasm and hull-less spring barley genotypes respectively. Therefore, this study aimed to estimate the magnitude of genetic distance and identify the major traits contributing to the observed variations among barley advanced line genotypes using multivariate analysis.
Description of the study sites
The experiment was conducted during the 2021/2022 main cropping season at the Woreilu Farmer Training Center (FTC). The experimental site is located at 10°49′N latitude and 39°28′E longitude, with an altitude of 2770 meters above sea level. Its mean annual rainfall is 840 mm with an average maximum and minimum temperature of 22.5°C and 15.5°C respectively. The dominant soil types in the area are vertisol and clay soils [10].
Experimental materials
A total of 49 six-row barely genotypes from Holetta Agricultural Research Center including one released variety (HB1966) as standard checks were used for the experiment.
Experimental design and agronomic practice
The experimental materials were laid out in 7 × 7 simple lattice designs and each genotype was planted on a plot size of 3 m² (2.5 m × 1.2 m). The distance between replications, blocks and plots was 1.5 m, 1 m and 0.5 m respectively. Each plot consisted of a 2.5 m length with 20 cm spacing between rows. Planting was done by hand drilling using a seed rate of 100 kg ha-1 for each treatment.
Description of collected data
The following fifteen phonological, growth, yield and yield component data were collected on a plot and plant basis from each experimental unit. These traits were: Days to 50% Heading (DH), Days to 90% Maturity (DM), biomass yield (kg), Grain Yield (GY), Thousand kernels weight (g), Harvesting Index (HI), Plant Height (PH), number of Tillers Per Plant (TPP), number of Fertile Tillers Per Plant (FTPP), number of Spikelets Per Spike (SPS), Spike Length (SL), Number of Seed Per Spike (NSPS), Internode Per Plant (IPP), Peduncle Length (PL) and Awn Length (AL).
Data analysis
Analysis of variance was done using Proc Generalized Linear Model (GLM) procedures of Statistical Analysis System (SAS) software after testing the Analysis of Variance (ANOVA) assumptions. Cluster analysis was conducted following the agglomerative hierarchical clustering Ward’s method to categorize genotypes into different homogeneous groups using XLSTAT. The number of the cluster was determined based on SAS computer software dissimilarity technique. The dendrogram was built based on agglomerative hierarchical clustering ward’s method using XLSTAT, by using the following formula [11].
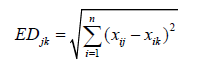
Where,
EDjk = Distance between genotypes j and k,
xij and xik=Value of phenotypic trait of the ith character for genotypes j and k, respectively,
n=Number of phenotypic traits used to calculate the distance,
Average intra and inter cluster distance values were estimated by using XLSTAT software [12].

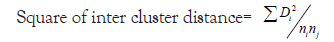
Where,
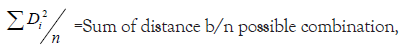
ni=Number of genotypes in cluster i,
nj=Number of genotypes in cluster j
Test of significance for cluster distance was done both at 1% and 5% probability level using Chi-square (χ²) distribution.
The principal component based on correlation matrix was calculated using XLSTAT 2014 Software, to identify the traits that contributed to the large part of the total variation. The first principal component accounts for maximum variability in the data with respect to succeeding components [13].
Analysis of variance
The result of ANOVA revealed the presence of highly significant variation among genotypes (P<0.01) for all studied traits except internode per plant and thousand kernel weight.
Cluster analysis
The distribution of genotypes into five clusters implied the prevalence of genetic variation among genotypes for most traits under consideration. Cluster II was the largest which comprised sixteen genotypes followed by Cluster III with fourteen genotypes, Cluster IV with ten genotypes and Cluster I with five genotypes whereas Cluster V consisted of the smallest number of genotypes (four) (Table 1 and Figure 1). The Dendrogram also revealed that the genotypes were classified into two wider groups, group one containing Clusters I, II, III and V and also other group containing only Cluster IV. Genotypes within these two wider groups indicate the presence of wide variability among genotypes between the wider clusters to undertake crossing. Generally, the analysis showed that genotypes were distributed in different clusters indicating the existence of variations among the studied genotypes, showing a high probability of recombination. Similarly, the clustering of barley genotypes was documented by different researchers studied 52 barley landrace accessions in North Western Ethiopia and categorized them into six clusters [14]. Derbew [15] also grouped twenty-two hulled barley genotypes into five clusters.
| Cluster No | Total number of genotypes | Genotypes clustered |
|---|---|---|
| I | 5 | (HB1966), (IBON14), (IBON40), (IBON29), (IBON9) |
| II | 16 | (IBON46), (IBON12), (IBON5), (IBON6), (IBON19), (IBON10), (IBON25), (IBON3), (IBON13), (IBON38), (IBON21), (IBON4), (IBON7), (IBON17), (IBON41), (IBON23) |
| III | 14 | (IBON47), (IBON31), (IBON18), (IBON15), (IBON32), (IBON43), (IBON11), (IBON2), (IBON35), (IBON30), (IBON36), (IBON34), (IBON42), (IBON48) |
| IV | 10 | (IBON1), (IBON22), (IBON27), (IBON20), (IBON37), (IBON26), (IBON44), (IBON8), (IBON39), (IBON33) |
| V | 4 | (IBON16), (IBON24), (IBON45), (IBON28) |
Table 1: The distribution of 49 food barley genotypes into five clusters based on D2 analysis.

Figure 1: Dendrogram observation of 49 food barley genotypes.
Genetic distance
The cluster formation and finding out intra and inter cluster divergence provides a basis for selecting genetically divergent parents and it may be useful to produce crosses between genotypes belonging to the clusters separated by large estimated distances [16]. The average intra and inter cluster Distance (D2) value indicated in (Table 2). The χ² test for five clusters revealed that genetic divergences between pairs were highly significant (P<0.01) for most of the clusters and significant (P<0.05) for cluster I with II and cluster IV with V whereas, cluster II with III and III with V showed non-significant different. This non-significant different between a pair of clusters indicate a closer relationship between these two clusters and low degree of diversity among the genotypes. So, crossing of genotypes from these clusters may not produce a high amount of heterotic expression in the F1 and narrow range of variability in the segregating (F2) population [17]. Inter-cluster distance ranged from 20.19 to 86.64. The maximum inter-cluster distance was observed between cluster I and IV (86.64), followed by cluster I and V (63.01), II and IV (61.12), I and III (45.75), III and IV (41.56), II and VI (38.75), IV and V (27.42), I and II (27.16), III and V (21.60). Genotypes belonging to the clusters with maximum inter cluster distances are genetically more divergent and hybridization between genotypes of divergent clusters is likely to produce wide variability with desirable segregants [18]. The minimum inter-cluster distance was observed between cluster II and III (20.19). Thus, crossing of genotypes from these two clusters may not produce high heterotic values in the F1’s and broad spectrum of variability in segregating (F2) populations. For isolating useful recombinants in the segregating generation hybrid parents could be selected on the bases of large inter-cluster distance [19]. The minimum intra-cluster distance was observed within cluster V followed by cluster IV and III. Showing that the genotypes in this group were genetically closer than any other groups but genotypes in the same cluster are not exactly the same hence, better to consider individual parent characterization while selecting for crossing. Align with this study on 225 landraces and reported that highest inter cluster distance as 47.0 between Cluster III and VIII and as 42.4 between cluster VII and IX. Hailu et al., [20] reported the highest inter cluster distance across location. Enyew et al., [14] also reported highest inter cluster distances between clusters III and VI.
| Cluster I | Cluster II | Cluster III | Cluster IV | Cluster V | |
|---|---|---|---|---|---|
| Cluster I | 19.19 | ||||
| Cluster II | 27.16* | 15.47 | |||
| Cluster III | 45.75** | 20.19ns | 15.03 | ||
| Cluster IV | 86.64** | 61.12** | 41.56** | 12.79 | |
| Cluster V | 63.01** | 38.75** | 21.60ns | 27.42* | 9.32 |
Note: (*): At 95% level of probability (0.05) is 23.69; (**): At 99% level of probability (0.01) is 29.14; (ns): Non-significant.
Table 2: Average intra (bold diagonal) and inter cluster distance (below diagonal) among 49 food barley genotypes in to five clusters.
Cluster mean analysis
Genetic relationships among forty-nine food barley genotypes, based on fifteen quantitative traits and the mean values for each cluster is presented in Table 2. For all traits except harvesting index genotypes grouped in cluster I had the maximum cluster mean values followed by genotypes assigned in cluster II. Cluster I consisted of five genotypes having the characteristic of latest heading and maturity; longest plant height, spike length, awn length and peduncle length with large number of tillers per plant, fertile tiller per plant, number of spike late per spike, number of seed per spike and number of internodes per plant and also highest value of biological yield, grain yield and thousand grain weight. Cluster II consisted of sixteen genotypes with relatively highest values for number of spike late per spike, number of seed per spike, awn length and harvesting index. Genotypes included in this cluster could be used for developing varieties with maximum number of spike late per spike and number of seed per spike. Cluster III consisted of fourteen genotypes with the second-best value for thousand kernel weights and peduncle length and also medium value for days to heading, days to maturity, plant height, tiller per plant fertile tiller per plant spike late per spike, spike length, number of seed per spike inter node per plant, awn length, biological yield, grain yield and harvesting index. Cluster IV consisted of ten genotypes having the characteristic of early heading and maturity; the shortest plant height, awn length and peduncle length with low number of tillers per plant, fertile tiller per plant. So the genotype assigned in this cluster could be used as parents to develop superior cultivars for dry-land areas, where terminal moisture-stress is a major problem. Cluster V consisted of four genotypes it exhibited lowest values for spike late per spike, spike length, number of seed per spike and harvesting index. It was also characterized by the second lowest value for all traits except these three traits (Table 3).
| Traits | Cluster number | ||||
|---|---|---|---|---|---|
| I | II | III | IV | V | |
| DTH | 76.06 | 73.89 | 69.32 | 62.24 | 67.75 |
| DTM | 118.23 | 115.2 | 111.29 | 105.08 | 113.61 |
| PH | 84.68 | 73.12 | 69.46 | 64.71 | 69.64 |
| TPP | 4.7 | 4.02 | 3.48 | 2.76 | 3.43 |
| FTPP | 4.4 | 3.72 | 3.01 | 2.19 | 2.73 |
| SPS | 23.81 | 23.12 | 22.8 | 20.61 | 18.54 |
| SL | 7.56 | 7.22 | 7.05 | 6.58 | 6.4 |
| NSPS | 70.79 | 68.9 | 68.14 | 61.81 | 55.29 |
| IPP | 5.53 | 4.88 | 4.71 | 4.6 | 4.61 |
| AL | 13.86 | 13.75 | 12.63 | 11.59 | 12.3 |
| PDL | 29.26 | 24.69 | 24.96 | 21.98 | 23.81 |
| BY | 14279 | 12000 | 10299 | 6532 | 8840 |
| GY | 4697 | 4279 | 3503 | 2377 | 2781 |
| TKW | 49.17 | 44.9 | 46.56 | 43.79 | 44.64 |
| HI | 32.82 | 35.74 | 34.17 | 36.82 | 31.98 |
Note: DTH: Days to 50% Heading; DTM: Days to 90% Maturity; PH: Plant Height; TPP: Number of Tillers Per Plant; FTPP: Number of Fertile Tillers Per Plant; SPS: Number of Spiklets Per Spike; SL: Spike Length; NSPS: Number of Seed Per Spike; IPP: Number of Inter node Per Plant; AL: Awn Length; PDL: Peduncle Length; BY: Biomass Yield; GY: Grain Yield; TKW: Thousand Kernel Weight; HI: Harvest Index.
Table 3: Cluster mean values for 15 quantitative traits of 49 food barley genotypes.
Principal component analysis
The first four Principal Components (PCs) explained 80.356% of the total variation and provided in Table 4. PC1 explained 45.773%, PC2 showed 16.068%, PC3 explained 10.345% and PC4 had 8.170%. Traits such as days to heading, tiller per plant, fertile tiller per plant, awn length, biological yield and grain yield explain the highest variation of the PC1 through positive loading. Traits such as spike late per spike, spike length and number of seed per spike explain the highest variation on PC2 through positive loading and plant height; inter node per plant, peduncle length and thousand kernel weights through negative loading. The trait that contributes to PC3 was harvesting index through positive loading while, spike late per spike, spike length, internode per plant and biological yield through negative loading. The fourth principal component affected by plant height, spike late per spike, number of seed per spike, peduncle length and thousand kernel weights through positive loading and fertile tiller per plant through negative loading to the genetic variation. The character contributing the maximum loading for variation should be given greater emphasis. In agreement with the current study Hailu et al., [20] reported the first four PCs explained 82.16% of the variation of 11 quantitative traits of barley genotype. The four PCs explained 86.5% of the variation among 16 accessions of barley crop for ten quantitative traits. Hailu et al., [20] conducted research activity on 48 barley landrace accessions and determine three important PCs which were responsible for 74.20% of the total variation based on 12 morphological traits. A study by Derbew [15] revealed three most important PCs which contributed a total of 77% of the total variance for eight quantitative traits.
| Eigen vectors | ||||
|---|---|---|---|---|
| Traits | PCA1 | PCA2 | PCA3 | PCA4 |
| DTH | 0.318 | -0.164 | 0.032 | -0.072 |
| DTM | 0.288 | -0.194 | 0.051 | -0.173 |
| PH | 0.252 | -0.307 | -0.198 | 0.227 |
| TPP | 0.326 | 0.067 | 0.155 | -0.175 |
| FTPP | 0.333 | 0.035 | 0.159 | -0.205 |
| SPS | 0.219 | 0.447 | -0.203 | 0.219 |
| SL | 0.169 | 0.422 | -0.307 | 0.063 |
| NSPS | 0.217 | 0.459 | -0.177 | 0.223 |
| IPP | 0.13 | -0.283 | -0.488 | -0.143 |
| AL | 0.329 | -0.059 | 0.179 | -0.178 |
| PDL | 0.183 | -0.238 | 0.147 | 0.513 |
| BY | 0.329 | -0.099 | -0.214 | -0.087 |
| GY | 0.364 | 0.05 | 0.147 | -0.044 |
| TKW | 0.088 | -0.215 | 0.066 | 0.638 |
| HI | 0.074 | 0.218 | 0.614 | 0.084 |
| Eigen value | 6.866 | 2.41 | 1.552 | 1.226 |
| Variability (%) | 45.773 | 16.068 | 10.345 | 8.17 |
| Cumulative% | 45.773 | 61.84 | 72.186 | 80.356 |
Note: DTH: Days to 50% Heading; DTM: Days to 90% Maturity; PH: Plant Height; TPP: Number of Tillers Per Plant; FTPP: Number of Fertile Tillers Per Plant; SPS: Number of Spiklets Per Spike; SL: Spike Length; NSPS: Number of Seed Per Spike; IPP: Number of Inter node Per Plant; AL: Awn Length; PDL: Peduncle Length; BY: Biomass Yield; GY: Grain Yield; TKW: Thousand Kernel Weight; HI: Harvest Index; PCA: Principal Component Analysis.
Table 4: Eigenvalues, total variance, cumulative variance and eigenvectors for 15 characters of food barley genotypes.
The bi-plot graph below in Figure 2 indicated the variability of genotypes for the 15 traits under study. Those genotypes close to the center are more closely related with each other and the distant genotypes are more divergent. The scatter plot showed that the genotypes which have similar genetic makeup grouped in a cluster (near to overlap) and those genotypes have different genetics positioned in opposite corner of the scatter plot.

Figure 2: Biplots of first and second components for 15 quantitative traits of 49 food barley genotype.
A total of forty-nine food barley genotype including one standard check were evaluated for fifteen quantitative characters. The cluster analysis showed the 49 genotypes were distributed into five clusters of different sizes ranging from 16 genotypes in cluster II to four genotypes in V which indicated prevalence of genetic variation among genotypes that will help in identification and selection of the best parents. The maximum inter-cluster distance was observed between cluster I and IV (86.64) which indicated that selecting of genotypes from these two clusters for hybridization produce wide variability with desirable segregante. The first four principal component explained 80.356% of the total variation and the major quantitative traits contributing to variation among the studied genotypes include days to heading, tiller per plant, fertile tiller per plant, awn length, biological yield, grain yield, spike late per spike, spike length and number of seed per spike. Generally, the genotype used in this study are diversified and offer an opportunity for plant breeders to conduct further breeding activities through selecting the most promising genotype or by crossing these divergent genotypes with each other focusing on major agronomic traits. However, this study is conducted for one season at one location therefore; further study should be carried out in multiple locations across different season in order to make more reliable conclusion and recommendation. In addition, this genetic variability study of the present genotypes should be supported with molecular analysis techniques.
The author would like to thank for the financial support provided by Mekdela Amba University and I am also grateful to Holeta Agricultural Research Institute for its support in providing seeding materials to conduct this study.
[Crossref] [Google Scholar] [PubMed]
[Crossref] [Google Scholar] [PubMed]
Citation: Abebe K. Cluster and principal component analysis for yield and yield related traits of food barley (Hordeum vulgare L.) genotypes at Woreilu district, South wollo, Ethiopia. AGBIR.2024;40(3):1086-1090.
Received: 25-Mar-2024, Manuscript No. AGBIR-24-130077; , Pre QC No. AGBIR-24-130077 (PQ); Editor assigned: 27-Mar-2024, Pre QC No. AGBIR-24-130077 (PQ); Reviewed: 11-Apr-2024, QC No. AGBIR-24-130077; Revised: 19-Apr-2024, Manuscript No. AGBIR-24-130077 (R); Published: 26-Apr-2024, DOI: 10.35248/0970-1907.24.40.1086-1090
Copyright: © This open-access article is distributed under the terms of the Creative Commons Attribution Non-Commercial License (CC BY-NC) (http:// creativecommons.org/licenses/by-nc/4.0/), which permits reuse, distribution and reproduction of the article, provided that the original work is properly cited and the reuse is restricted to noncommercial purposes. For commercial reuse, contact reprints@pulsus.com This is an open access article distributed under the terms of the Creative Commons Attribution License, which permits unrestricted use, distribution, and reproduction in any medium, provided the original work is properly cited.