An International Journal
Agricultural and Biological Research
ISSN - 0970-1907
RNI # 24/103/2012-R1
RNI # 24/103/2012-R1
Research Article - (2024) Volume 40, Issue 1
Tomato (Solanum lycopersicum L.) of Solanaceae family is an important vegetable worldwide. Among the vegetables, tomato ranks first among the processing crops. It is very good source of vitamins A, B, C and minerals. They are rich in suitable contents of minerals viz. iron, calcium, potassium, phosphorus and sulfur. Tomato is native of Andaman region that includes parts of Colombia, Ecuador, Peru, Bolivia and Chilli. All tomato wild relatives are native to this area. Early blight is one of the most destructive fungal diseases affecting potato, tomato, and other solanaceous plants like eggplant and pepper. This disease can destroy a tomato field in two or three weeks. Therefore, the present research was carried out to control the alternarial blight by using different bio agents and botanicals as well as their combinations at field of Department of Plant Pathology, Naini Agricultural Institute Sam Higginbottom University of Agriculture, Technology and Sciences, Prayagraj, Uttar Pradesh during 2018-2019. Different bioagents and botanicals where used in different concentrations. The experiment comprises seven treatment combination is T0:Control, T1:Neem oil+T. viride, T2:Neem oil+P. florescens, T3:T. viride+P. florescens, T4:T. viride+P. florescens+Neem oil, T5:Neem oil and T6:Trichoderma viride and T7:Pseudomonas flourescens. Results have revealed that the combination of Neem oil+Pseudomonas flourescens was the best effective in comparison to other treatment followed by Trichoderma viride+Pseudomonas flourescens+Neem oil was effective. It was also observed that these treatments are organic as well as it also has good cost benefit ratio.
Organic; Tomato; Bioagents; Botanicals; Effective concentrations
Tomato (Solanum lycoperiscum L.) is a diploid species with 2n=24 chromosomes and belongs to the family solanaceae. It is one of the most popular vegetable crops grown throughout the world because of its wider adaptability, high yielding potential and suitability for variety of cuisines in fresh as well as in preserved form. It is mostly considered as “Protective food” based on its nutritive value, antioxidant molecules such as carotenoids, particularly lycopene, ascorbic acid, vitamin E and phenol compounds, particularly flavonoids. Lycopene has important dietetic properties since it reduces the risk of several types of cancers and heart attacks [1]. Tomato ranks third in priority after Potato and Onion in India but ranks second after potato in the world. India ranks second in the area as well as in production of Tomato. The major tomato growing countries are China, USA, Italy, Turkey, India and Egypt. Tomato is able to produce more protein and carbohydrates per unit area than cereals and some leguminous crops like soybeans. It provides a substantial amount of vitamins and minerals. Ripe tomatoes have a high content of the antioxidant lycopene which plays a possible role in the prevention of certain forms of cancer [2]. Another important antioxidant is carotene also noted for its cancer prevention properties [3].
Early blight is one of the most destructive fungal diseases affecting potato, tomato, and other solanaceous plants like eggplant and pepper. This disease can destroy a tomato field in two or three weeks. Tomato crop is highly susceptible to plant pathogens viz. bacteria, fungi and viruses which deteriorate the yield and quality of tomato fruit. Early blight disease is one of the world's most catastrophic diseases resulting in economic yield losses. It is most important problems of tomato in Varanasi and Prayagraj region and average disease intensity vary from 35-40 per cent and 80-86 per cent losses caused by early blight in every year [4]. The disease had resulted of 78% loss in yield of fruit caused by Alternaria solani. Early blight caused by Alternaria solani is the most destructive disease reducing yield of tomato throughout the tomato growing areas of the world [5,6]. Saha and Das [7] reported yield loss of 0.76 t/ha for every 1% increase in disease severity. The disease appears on leaves, stems, petiole, twig and fruits. Symptoms appear as small black or brown spots on lower leaves after fruit set. They are usually about 0.25 to 0.5 inch in diameter. Spots are leathery and develop darker borders with a white center. The spots are in concentric pattern. As the disease progresses the color of the leaves turn yellow brown and drop off. In the center of spots black pycnidia develops which when become wet ooze out the fungal spores. The spores of the fungus are spread by insects, human contact, water and air. Favorable conditions for the disease are overhead irrigation, wet and warm weather conditions. A period of about 48 hours is required for infections to occur but it may be cumulative over several days not necessarily the continuous period. In garden the plant debris serve as inoculums source for primary infections in the spring. The spores of the fungi are the means of dissemination and also helpful in the identification and the classification of an organism. It was well established that the tomato early blight fungus could survive on the infected seeds for several days. But it is still speculative whether the seed borne inoculums of Alternaria solani serves as a source for triggering primary infection in the next season. The ability of pathogen to survive for a long time in the diseased plant parts and soil on the alternative collateral hosts in the absence of main host determines the ability of pathogen to perpetuate. Use of chemical or fungicide spray is used commonly by the farmers to manage the disease and reduce their losses but the human population has raised their voice against use of chemicals and the population has already started boycott of chemically produced food. Therefore, it has urged to find out best organic methods to manage the disease below threshold levels.
The field experiment was conducted in the field of Department of Plant Pathology, Sam Higginbottom University of Agriculture, Technology and Sciences, Prayagraj during Kharif season 2018-2019.The Experimental field is laid out by the Randomized Block Design (RBD) with three replications and the experimental field is divided into twenty-four plots. The experiment comprises seven treatment combination is T0:Control, T1:Neem oil+T. viride, T2:Neem oil+P. florescens, T3:T. viride +P. florescens, T4:T. viride+P. florescens+Neem oil, T5:Neem oil and T6:Trichoderma viride and T7:Pseudomonas flourescens. The site selection was uniform, cultivable with typical sandy loam soil having good drainage. Prayagraj (Allahabad) is situated at 25.27 North latitude 80.50 East longitudes and at an altitude of 98 meter above sea level. The climate is typically semi-arid and sub-tropical. The maximum temperature reaches up to 47°C in summer and drops down to 1.5°C in winters. Before transplanting the field was thoroughly ploughed and pulverized with tractor drawn cultivar to attain desirable tilth. Leveling and formation of plots were done manually. The field was then cleaned by picking the stubble of previous crop etc. one harrowing was applied to field before sowing. 20 to 25 days old seedlings were used for transplanting. They are transplanted in the main field in rows with spacing of 45 cm between rows and 40 cm distance between two successive plants.
The observations to be recorded, Pre-harvesting observation: Plant height (cm) at 30, 45, 60 and 75 DAT, Number of leaves per plant at 30, 45, 60 and 75 DAT, Number of branches per plant at 30, 45, 60 and 75 DAT and Disease intensity at 45, 60 and 75 Days after transplanting.
Post-harvesting observation
Disease intensity (%) was calculated by using the following formula:-


Cost benefit ratio
Cost benefit ratio is the ratio of gross return to cost of cultivation, which can also be expressed as return per rupee invested. This index provides an estimate of the benefit a farmer derives from the expenditure he incurs in adopting a particular cropping system. Any value above 2.0 is considered safe as the farmer gets Rs. 2 for every rupee invested. The benefit cost ratio was calculated using the following formula.

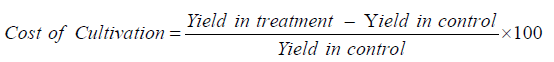
Cost of cultivation
Cost of cultivation is the total expenditure incurred for raising crops in a cropping system. The cost included for this purpose consists from University Department of Plant Pathology, SHUATS, Allahabad, or hired human labour, value of seed, manure, fertilizers, knapsack sprayer, weighing box, fungicides and irrigation charges.
Net returns
Net return is obtained by subtracting cost of cultivation from gross return. It is a good indicator of suitability of a cropping system since this represents the actual income to the farmer.
Statistical analysis
The data obtained were transformed to corresponding arc sin or square root values. Statistical analysis was done to test the level of significance and to compare the treatments. The data were subjected to statistical Analysis of variance. The f-test was used to determine the significant difference.
Identification of Alternaria solani from infected plant
Tomato leaflet shows target-ring lesions characteristic of early blight early in the season, but the greatest damage usually appears after fruit set. Under favorable environmental conditions for disease development, the fungus may also cause spotting of the fruit stems and blossoms and drop of young fruit. Early blight is most important problems of tomato in Varanasi region and average disease intensity vary from 35-40 and 80-86 per cent losses caused by early blight in every year [4].
Symptomology
During the study, typical symptoms of the disease were observed in tomato plant. The initial symptoms were small necrotic lesion at leaf margins and brown streak may occur on stems and petioles. A few small, irregular, discolored areas at the blossom end on the green fruit were produced which increased to form a superficial angular brownish patch on ripe fruit. The first symptoms usually appeared on leaves as water soaked oily, pale or dark-green or brown or black, circular or irregular lesions. Typically, younger, more succulent tissue was affected first. During periods of abundant moisture, sporulation of the pathogen could be seen by the naked eye as a white, cottony growth on the underside of affected leaves or on fruit lesions oily.
Effect of treatments on plant height (cm) at 30, 45, 60 and 75 DAT of tomato
The data presented at 30 DAT in Table 1 shows maximum plant height was recorded in treatment T2:Neem oil+P. florescens (23.13 cm) followed by the T4:T. viride+P. florescens+Neem oil (21.90 cm), T1:Neem oil+T. viride (20.63 cm), T5:Neem oil (19.67 cm), T3:T. viride+P. florescens (18.33 cm), T7:Pseudomonas flourescens (17.56 cm), T6:Trichoderma viride (16.30 cm) and the lowest treatment is T0:Control (15.50 cm). It was observed that treatments (T2, T4, T1), (T4, T1, T5), (T1, T5, T3), (T5, T3, T7), (T3, T7, T6), (T7, T6, T0) are found to be non-significant to each other but significant to other treatments. The data presented at 45 DAT maximum plant height was recorded in treatment T2:Neem oil+P. florescens (29.73 cm) followed by the T4:T. viride+P. florescens+Neem oil (28.40 cm), T1:Neem oil+T. viride (27.27 cm), T5:Neem oil (25.73 cm), T3:T. viride+P. florescens (24.47 cm), T7:Pseudomonas flourescens (22.83 cm), T6:Trichoderma viride (21.60 cm) and the lowest plant height in treatment T0:Control (20.06 cm).It was found that all the treatments are significant to each other. The data presented at 60 DAT the maximum plant height was recorded in treatment T2:Neem oil+P. florescens (43.33 cm) followed by the T4:T. viride+P. florescens+Neem oil (40.80 cm), T1:Neem oil+T. viride (39.67 cm), T5:Neem oil (36.67 cm), T3:T. viride+P. florescens (32.27 cm), T7:Pseudomonas flourescens (28.40 cm), T6:Trichoderma viride (27.20 cm) and the lowest plant height in the treatmentT0:Control (27.07 cm).
| Treatments | 30 DAT | 45 DAT | 60 DAT | 75 DAT | |
|---|---|---|---|---|---|
| T0 | Control | 15.5 | 20.1 | 27.1 | 32.9 |
| T1 | Neem oil+T. viride | 20.6 | 27.3 | 39.7 | 41.9 |
| T2 | Neem oil+P. florescens | 23.1 | 29.7 | 43.3 | 45.9 |
| T3 | T. viride+P. florescens | 18.3 | 24.5 | 32.3 | 37.7 |
| T4 | T. viride+P. florescens+Neem oil | 21.9 | 28.4 | 40.8 | 42.4 |
| T5 | Neem oil | 19.6 | 25.7 | 36.7 | 38.7 |
| T6 | Trichoderma viride | 16.3 | 21.6 | 27.2 | 34.8 |
| T7 | Pseudomonas flourescens | 17.6 | 22.8 | 28.4 | 37.4 |
| Result | S | S | S | S | |
| C. D. (0.05) | 2.555 | 1.13 | 1.04 | 0.843 | |
| S. Ed (±) | 1.193 | 0.522 | 0.485 | 0.392 | |
Table 1: Effect on plant height (cm) against botanicals, bio-agents and their combinations at 30, 45, 60 and 75 DAT of tomato (Solanum lycopersicum L.).
It was observed that treatment T2 found most significant among all the treatments. Whereas, other treatments are significant to each other but treatments (T6 and T0) are non-significant to each other and the data presented at 75 DAT shows the maximum plant height was recorded in treatment T2:Neem oil+P. florescens (45.93 cm) followed by the T4:T. viride+P. florescens+Neem oil (42.40 cm), T1:Neem oil+T. viride (41.20 cm), T5:Neem oil (38.73 cm), T3:T. viride+P. florescens (37.73 cm), T7:Pseudomonas flourescens (37.40 cm), T6:Trichoderma viride (34.80 cm) and the lowest plant height in the treatment T0:Control (32.87 cm). It was observed that T2 found most significant among all the treatments whereas (T3 and T7) are non-significant to each other and significant to other treatments statically for plant height. These results agreement with Afroz et al., [8], Alagesaboopathi and Selvankumar [9] and Dheeba et al., [10].
Effect of treatments on number of branches at 30, 45, 60 and 75 DAT of tomato
The data presented at 30 DAT in Table 2 showed that maximum number of branches was recorded in treatment T2:Neem oil+P. florescens (10.37) followed by the T4:T. viride+P. florescens+Neem oil (9.83), T1:Neem oil+T. viride (8.56), T5:Neem oil (8.17), T3:T. viride+P. florescens (7.10), T7:Pseudomonas flourescens (6.83), T6:Trichoderma viride (6.60) and the lowest number of branches in treatment T0:Control (5.53). It was observed that treatments (T2,T4),(T4,T1),(T1,T5),(T5,T3,T7),(T3,T7,T6), (T7,T6,T0) are found to be non-significant to each other whereas significant to the other treatments statistically for number of branches. At 45 DAT the maximum number of branches was recorded in treatment T2:Neem oil+P. florescens (13) followed by the T4:T. viride+P. florescens+Neem oil (12.20), T1:Neem oil+T. viride (10.80), T5:Neem oil (10.53), T3:T. viride+P. florescens (9.46), T7:Pseudomonas flourescens (8.93), T6:Trichoderma viride (8.53) and the lowest number of branches in treatment T0:Control (8.06). It was observed that T2 found to be most significant followed by T4 among all the treatments whereas (T1,T5), (T3,T7), (T7,T6), (T6,T0) are non-significant to each other and significant to the other treatments statistically.
| Treatments | 30 DAT | 45 DAT | 60 DAT | 75 DAT | |
|---|---|---|---|---|---|
| T0 | Control | 5.5 | 8.1 | 12.03 | 12.7 |
| T1 | Neem oil+T. viride | 8.6 | 10.8 | 13.9 | 15.1 |
| T2 | Neem oil+P. florescens | 10.4 | 13 | 16.1 | 17.3 |
| T3 | T. viride+P. florescens | 7.1 | 9.5 | 13.1 | 13.7 |
| T4 | T. viride+P. florescens+Neem oil | 9.8 | 12.2 | 15.1 | 15.3 |
| T5 | Neem oil | 8.2 | 10.5 | 13.4 | 14.8 |
| T6 | Trichoderma viride | 6.6 | 8.5 | 12.6 | 12.9 |
| T7 | Pseudomonas flourescens | 6.8 | 8.9 | 12.7 | 13.2 |
| Result | S | S | S | S | |
| C. D. (0.05) | 1.38 | 0.745 | 0.628 | 0.469 | |
| S. Ed (±) | 0.647 | 0.353 | 0.286 | 0.222 | |
Table 2: Effect on number of branches against botanicals, bio-agents and their combinations of tomato (Solanum lycopersicum L.).
The data presented at 60 days after transplanting the maximum number of branches was recorded in treatment T2:Neem oil+P. florescens (16.13) followed by the T4:T. viride+P. florescens+Neem oil (15.13), T1:Neem oil+T. viride (13.86), T5:Neem oil (13.40), T3:T. viride+P. florescens (13.06), T7:Pseudomonas flourescens (12.73), T6:Trichoderma viride (12.66) and the lowest number of branches in treatment T0:Control (12.03). It was observed that T2 is the most significant treatment among all the treatments whereas (T1, T5), (T5, T3), (T3, T7, T6) are non-significant to each other.
The data presented at 75 DAT shows maximum number of branches was recorded in treatment T2:Neem oil+P. florescens (17.26) followed by the T4:T. viride+P. florescens+Neem oil (15.33), T1:Neem oil+T. viride (15.06), T5:Neem oil (14.80), T3:T. viride+P. florescens. (13.66), T7:Pseudomonas flourescens (13.20), T6:Trichoderma viride (12.86) and the lowest number of branches in treatment T0:Control (12.66). It was found that T2 is the most significant among all treatments whereas (T4,T1), (T1,T5), (T3,T7), (T7,T6), (T6,T0) are non-significant to each other’s statistically. These results agreement with Afroz et al., [8], Alagesaboopathi and Selvankumar [9] and Dheeba et al., [10].
Effect of treatments on number of leaves at 30, 45, 60 and 75 DAT of tomato
The data presented at 30 DAT in Table 3 shows the maximum number of leaves was recorded in treatment T2:Neem oil+P. florescens (48.53) followed by the T4:T. viride+P. florescens+Neem oil (47.96), T1:Neem oil+T. viride (47.50), T5:Neem oil (46.70), T3:T. viride+P. florescens (43.93), T7:Pseudomonas flourescens (42.70), T6:Trichoderma viride (37.30) and the lowest number of leaves in treatment T0:Control (33.36). It was observed that for maximum number of leaves (T2, T4, T1, T5, T3, T7), (T3, T7, T6), (T6, T0) are found to be non-significant to each other whereas significant to other treatments. The data presented at 45 days after transplanting showed the maximum number of leaves was recorded in treatment T2:Neem oil+P. florescens (59.80) followed by the T4:T. viride+P. florescens+Neem oil (55.73), T1:Neem oil+T. viride (53.26), T5:Neem oil (47.86), T3:T. viride+P. florescens (45.73), T7:Pseudomonas flourescens (44.80), T6:Trichoderma viride (44.53) and the lowest number of leaves in treatment T0:Control (36.53). It was observed that for maximum number of leaves, T2 is found to be most significant among all treatments, whereas (T4, T1), (T5, T3, T7, T6) are non-significant to each other and the lowest leaves where recorded in T0.
| Treatments | 30 DAT | 45 DAT | 60 DAT | 75 DAT | |
|---|---|---|---|---|---|
| T0 | Control | 33.7 | 36.5 | 46.1 | 48.3 |
| T1 | Neem oil+T. viride | 47.5 | 53.3 | 59.1 | 60.3 |
| T2 | Neem oil+P. florescens | 48.5 | 59.8 | 67 | 68.8 |
| T3 | T. viride+P. florescens | 43.9 | 45.7 | 53.7 | 54.3 |
| T4 | T. viride+P. florescens+Neem oil | 47.9 | 55.7 | 64.1 | 64.5 |
| T5 | Neem oil | 46.7 | 47.9 | 55.9 | 56.7 |
| T6 | Trichoderma viride | 37.3 | 44.5 | 49.2 | 51.4 |
| T7 | Pseudomonas flourescens | 42.7 | 44.8 | 52.5 | 53.7 |
| Result | S | S | S | S | |
| C. D. (0.05) | 7.155 | 3.96 | 3.536 | 1.175 | |
| S. Ed (±) | 3.333 | 1.722 | 1.649 | 0.55 | |
Table 3: Effect on number of leaves against botanicals, bio-agents and their combinations at 30, 45, 60 and 75 DAT of tomato (Solanum lycopersicum L.).
The data presented at 60 days after transplanting shows maximum number of leaves was recorded in treatment T2:Neem oil+P. florescens (67) followed by the T4:T. viride+P. florescens+Neem oil (64.06), T1:Neem oil+T. viride (59.06), T5:Neem oil (55.93), T3:T. viride+P. florescens (53.73), T7:Pseudomonas flourescens (52.53), T6:Trichoderma viride (49.20) and the lowest number of leaves in treatment is T0:Control (46.06). It was observed that for maximum number of leaves (T2, T4), (T1, T5), (T3, T5, T7), (T7, T6), (T6, T0) are non-significant to one another whereas significant to other treatments.
At 75 DAT the maximum number of leaves was recorded in treatment T2:Neem oil+P. florescens (68.80) followed by the T4:T. viride+P. florescens+Neem oil (64.53), T1:Neem oil+T. viride (60.26), T5:Neem oil (56.66), T3:T. viride+P. florescens (54.33), T7:Pseudomonas flourescens (53.66), T6:Trichoderma viride (51.40) and the lowest number of leaves in treatment T0:Control (48.33). It was observed that for maximum number of leaves T2 found to be most significant among all treatments whereas treatments (T3,T7) are non-significant to each other but significant to the other treatments. These results agreement with Afroz et al., [8], Alagesaboopathi and Selvankumar [9] and Dheeba et al., [10].
Effect of treatments on Alternarial leaf blight disease intensity at 45, 60 and 75 DAT of tomato
The data presented at 45 DAT in Table 4 shows maximum reduction percentage of disease intensity was recorded in treatment T2:Neem oil+P. florescens (17.86%) followed by the T4:T. viride+P. florescens+Neem oil (18.20%), T1:Neem oil+T. viride (18.73%), T5:Neem oil (20.70%), T3:T. viride+P. florescens (20.76%), T7:Pseudomonas flourescens (23.23%), T6:Trichoderma viride (23.93%) and the lowest disease intensity in treatment T0:Control (29.88%).
| Treatments | 45 DAS | 60 DAS | 75 DAS | |
|---|---|---|---|---|
| T0 | Control | 29.88 | 59.36 | 61.4 |
| T1 | Neem oil+Trichoderma | 18.73 | 35.8 | 37.17 |
| T2 | Neem oil+Pseudomonas | 17.86 | 30.33 | 33.53 |
| T3 | Trichoderma+Pseudomonas | 20.77 | 41.26 | 43.63 |
| T4 | Trichoderma+Pseudomonas+Neem oil | 18.2 | 35.6 | 36.17 |
| T5 | Neem oil | 20.7 | 37.93 | 38.37 |
| T6 | Trichoderma viride | 23.93 | 49.73 | 57.6 |
| T7 | Pseudomonas flourescens | 23.23 | 48.53 | 52.77 |
| Result | S | S | S | |
| C. D. (0.05) | 5.981 | 8.086 | 10.204 | |
| S. Ed (±) | 2.79 | 3.769 | 4.695 | |
Table 4: Effect of treatment and their combinations on Alternarial disease intensity at 45, 60 and 75 DAT of tomato (Solanum lycopersicum L.).
It was observed that treatment T2 (17.86%) is the most significant among all treatments as it gives the least disease intensity. whereas T0 (29.88%) gives higher disease intensity followed by T6 (23.93%). However, (T0, T6), (T6, T7, T3, T5, T1, T4), (T7, T3, T5, T1, T4, T2) are non-significant to each other but significant to other treatments. The data presented at 60 days after transplanting the maximum reduction percentage of disease intensity was recorded in treatment T2:Neem oil+P. florescens (30.33%) followed by the T4:T. viride+P. florescens+Neem oil (35.60%), T1:Neem oil+T. viride (35.80%), T5:Neem oil (37.93%), T3:T. viride+P. florescens (41.26%), T7:Pseudomonas flourescens (48.53%), T6:Trichoderma viride (49.73%) and the lowest disease intensity in treatment T0:Control (59.36%). Among all treatment, highest disease intensity was recorded in T0 (59.36) and lowest in T2 (30.33) and T2 found to be most significant than other treatments. However, treatments (T6, T7), (T7, T3), (T3, T5, T1, T4), (T5, T1, T4, T2) are non-significant to each other but significant to other treatments and at 75 DAT the maximum reduction percentage of disease intensity was recorded in treatment T2:Neem oil+P. florescens (33.53%) followed by the T4:T. viride+P. florescens+Neem oil (36.16%), T1:Neem oil+T. viride (37.16%), T5:Neem oil (38.36%), T3:T. viride+P. florescens (43.63%), T7:Pseudomonas flourescens (52.76%), T6:Trichoderma viride (57.60%) and the lowest disease intensity in treatment T0:Control (61.40%). It was observed that treatments (T0, T6, T7), (T7, T3), (T3, T5, T1, T4, T2) are non-significant to each other but significant to the other treatment.
Several plant diseases are generally caused by different types of detrimental microbes, such as fungi, bacteria, viruses, and nematodes [11]. Early blight symptoms are seen at all stages of plant growth. Symptoms appear first on leaves as dark brown to black lesions with concentric rings [12]. The conidia survive on the soil surface and on the old, dry lower leaves of the plant and spread under favorable conditions. Potato is severely affected by early blight, causing a significant impact on quality and tuber yield loss of up to 50% annually [13]. Several researchers and scientists have attempted to manage early blight disease. A successful disease-reducing strategy could comprise a single practice but to get long-term solutions to combating disease losses, it requires the combined application of various control strategies [14,15]. However, the disease can be managed by the use of a considerable number of fungicides and biocontrol agents combined with other management practices [16-18].
Cost benefit ratio
The yields among the treatments were significant. The highest yield was recorded in T2:Neem oil+P. flourescens (153 q/ha) followed by the T4:T. viride+P. florescens+Neem oil (141 q/ha), T1:Neem oil+T. viride (135 q/ha), T5:Neem oil (117 q/ha), T3:T. viride+P. florescens (105 q/ha), T7:Pseudomonas flourescens (103 q/ha), T6:Trichoderma viride (95 q/ha) and the lowest was recorded in treatment T0:Control (90 q/ha). This single trial shows that highest B:C ratio was in treatment T2:Neem oil+P. flourescens (1:3.87) followed by the T4:T. viride+P. florescens+Neem oil (1:3.54), T1:Neem oil+T. viride (1:3.43), T5:Neem oil (1:2.9), T3:T. viride+P. florescens (1:2.7), T7:Pseudomonas flourescens (1:2.67), T6:Trichoderma viride (1:2.5) and the lowest B:C ratio was recorded in treatment T0:Control (1:2.3) (Table 5).
| Treatment | Yield of q/ha | Cost of yield (Rs/q) | Total cost of yield (Rs.) | Common Cost (Rs.) | Treatment cost (Rs.) | Total cost | C:B ratio |
|---|---|---|---|---|---|---|---|
| T0 Control | 90 | 1500 | 135000 | 56745 | ------ | 56745 | 01:02.3 |
| T1 Neem oil+T. viride | 135 | 1500 | 202500 | 56745 | 2280 | 59025 | 01:03.4 |
| T2 Neem oil+P. flourescens | 153 | 1500 | 229500 | 56745 | 2500 | 59245 | 01:03.9 |
| T3 T. viride+P. flourescens | 105 | 1500 | 157500 | 56745 | 1420 | 58165 | 01:02.7 |
| T4 T. viride+P. flourescens+Neem oil | 141 | 1500 | 211500 | 56745 | 2920 | 59665 | 01:03.5 |
| T5 Neem oil | 117 | 1500 | 175500 | 56745 | 1860 | 58605 | 01:02.9 |
| T6 Trichoderma viride | 95 | 1500 | 142500 | 56745 | 780 | 57525 | 01:02.5 |
| T7 Pseudomonas flourescens | 103 | 1500 | 154500 | 56745 | 1000 | 57745 | 01:02.7 |
Table 5: Effect of treatment and their combinations on cost benefit ratio of tomato (Solanum lycopersicum L.).
On the basis of present investigation, it is concluded that the combination of Neem oil+Pseudomonas flourescens was the best effective in comparison to other treatment followed by Trichoderma viride+Pseudomonas flourescens+Neem oil was effective. Neem oil and Pseudomonas flourescens have shown the most effective results on plant height, no. of branches, minimum disease intensity and good yield. Even it has the highest cost benefit ratio. In control has shown the minimum plant height, no. of branches, no. of leaves, maximum disease incidence and low cost benefit ratio was recorded. Hence, from the present study it can be concluded that botanicals and bio agents along with their combination can be used effectively to reduce the disease intensity and get better yield. Even it will be safer to use botanicals and bio agents for avoiding the toxic effects of chemicals on human and soil health. Even, using such bio agents and botanicals farmer can effectively reduce its cost of cultivation and obtain good price for their produce in the market by claiming it as the organically managed product.
[Crossref] [Google Scholar] [PubMed]
[Google Scholar] [PubMed]
[Crossref] [Google Scholar] [PubMed]
[Crossref] [Google Scholar] [PubMed]
Citation: Dubey AK, Tiwari S, Lal B, et al. Comparative effect of neem oil and bioagents against leaf blight of tomato (Solanum lycopersicum L.) caused by Alternaria solani. AGBIR.2024;40(1):807-811.
Received: 05-Dec-2023, Manuscript No. AGBIR-23-122056; , Pre QC No. AGBIR-23-122056 (PQ); Editor assigned: 07-Dec-2023, Pre QC No. AGBIR-23-122056 (PQ); Reviewed: 25-Dec-2023, QC No. AGBIR-23-122056; Revised: 03-Jan-2024, Manuscript No. AGBIR-23-122056 (R); Published: 11-Jan-2024, DOI: 10.35248/0970-1907.24.40.807- 811
Copyright: This open-access article is distributed under the terms of the Creative Commons Attribution Non-Commercial License (CC BY-NC) (http:// creativecommons.org/licenses/by-nc/4.0/), which permits reuse, distribution and reproduction of the article, provided that the original work is properly cited and the reuse is restricted to noncommercial purposes. For commercial reuse, contact reprints@pulsus.com This is an open access article distributed under the terms of the Creative Commons Attribution License, which permits unrestricted use, distribution, and reproduction in any medium, provided the original work is properly cited.