An International Journal
Agricultural and Biological Research
ISSN - 0970-1907
RNI # 24/103/2012-R1
RNI # 24/103/2012-R1
Research Article - (2024) Volume 40, Issue 1
Planning for the optimal use of water and soil resources, in addition to their protection, will lead to increased production, growth of farmer’s income and economic prosperity. Modifying and proposing the optimal model of cultivation that reduces water consumption and increases the efficiency of its use is one of the requirements of most of the critical plains. The current study aims to provide the optimal cultivation model by the groundwater resources in the aquifer level of the Qom-Kahak study area to compensate for the long-term cumulative deficit of the aquifer and to emphasize the indicators of agricultural sustainability in the twenty-year planning horizon. After preparing information about the cultivated area, the production cost and selling price of major agricultural products were estimated. Also, the net irrigation requirement was calculated in terms of irrigation efficiency. To simulate the behavior of rainfall components from different scenarios, the outputs of scenario A2 of the Hadley Centre Coupled Model version 3 (HADCM3) climate model were used and by using the balance continuity equation, the amount of water that can be allocated to the agricultural sector each year was estimated. Then, by using fuzzy ideal planning models, sustainable agricultural patterns were presented in the framework of technical limitations. The results showed that the current cultivation pattern is not in an optimal state and also the current exploitation rate is more than the amount of aquifer recharge. If this scenario is implemented, 536 MCM (Thousands of circular mils) of the reservoir deficit will be compensated for the sustainability of the groundwater and it is predicted this amount will increase to 941 MCM at the end of the planning horizon.
Agricultural water management; Optimal cultivation pattern; Fuzzy ideal programming; Aquifer; Climate models
Indiscriminate harvesting of water resources, lack of a proper operational plan and inappropriate time and place distribution of rainfall in most of the country’s plains have led to the reduction of the groundwater level and affected the long-term supply of water. Beneficiaries and consumers should simultaneously implement plans and programs in the field of water control and productivity in various sectors, including industry and agriculture as the main water consumers. Also, the government should plan as soon as possible and to prevent the water crisis in the coming years, from now on, provide the farmers and activists of this sector with a model of farming crops according to the conditions and climate of each region. In this regard, developing and proposing an optimal cultivation pattern by regional goals and needs to achieve economic, social and environmental goals will be an important step toward the sustainability of the country’s agriculture. Various studies have been conducted to determine the optimal pattern of cultivation with emphasis on sustainable agriculture with different goals and limitations, the results of most of these studies indicate that the patterns of cultivation in the studied areas are not suitable and the use of different mathematical planning patterns in the formulation of cropping patterns in addition to improving the existing conditions makes resources and inputs to be used more optimally [1,2]. During the research, Tafteh et al., [3] investigated a schedule for irrigation water distribution as well as an optimal cultivation pattern to maximize net profit on the one hand and water productivity on the other hand. Since the production function is the most important part of water distribution models, they checked and calibrated the best available production functions, the results showed that water productivity could be increased by 20-40% using the Multi-Group Analysis (MGA) technique. However, the investigation of water shortage conditions showed that a water shortage of 30 to 35% can lead to a 54% increase in water productivity [3]. In a study of Nadia district, West Bengal, India, Biswas et al., [4] showed how fuzzy objective programming could be effectively used to model and solve land use planning problems in agricultural systems for optimal production of multiple seasonal crops in a planning year. The main advantage of their proposed approach was that the decision for the appropriate allocation of arable land for the production of seasonal crops can be made based on the needs of the community [4]. Considering the effects of climate change on agriculture and water allocation, it is very important to examine farmer’s perceptions and stakeholder’s views on climate change adaptation strategies for sustainable development in the future. Zamani et al., [5] in a study, a fuzzy-based decision support system for evaluating and developing a ranking of the proposed adaptation scenarios to climate change in the Jareh agricultural water resources system in southwest Iran. The final results of their research indicated the superiority of improving irrigation efficiency and reducing the cultivated area over other proposed scenarios [5]. Lobell et al., [6] assessed the impact of climate change on six major perennial crops in California: Wine grapes, almonds, table grapes, oranges, walnuts and avocados. The outputs of multiple climate models were used to assess climate uncertainty, they showed that depending on the product and the path of climate change, climate change uncertainty generally had a greater impact on predictions than product model uncertainty, considering given the long time scales for the growth and production of orchards and vineyards (about 30 years), climate change should be an important factor in selecting perennial varieties and deciding whether and where to plant perennials [6]. Moriondo et al., [7] projected a scenario of European agriculture to assess the potential impact of climate change and variability and to test the effectiveness of different adaptation options. The results of their work showed that both changes in the average climate and climate variability affect crop growth and as a result, the capacity of the crop to cope with climate changes is different [7]. Olesen et al., [8] investigated the uncertainties and sources of variation in the projected impacts of climate change on agriculture and terrestrial ecosystems using different impact models at site, regional and continental scales and by disaggregating variations in simulated relative changes in ecosystem functioning. They examined different sources of uncertainty and variability using variance analysis. The results of their research showed that site-based regional and continental scale models showed large spatial changes in the response of nitrate leaching from winter wheat crops to predicted climate changes due to strong interactions with soil and climate. Differences in simulated impacts between scenarios based on Regional Climate Models (RCMs) nested within the same Global Climate Model (GCM) were smaller than scenarios based on different GCMs or between release scenarios [8]. Ustaoglu et al., [9] aimed to develop a spatial model for assessing land suitability for suburban agricultural development using Geographic Information Systems (GIS) integrated with Multi-Criteria Decision Analysis (MCDA) techniques in the Pendik district of Istanbul (Turkey). They classified the suitability of land in GIS using specified fuzzy membership functions. The weights of the main criteria and their sub-criteria were determined through the Analytic Hierarchy Process (AHP) method. Finally, eight different regions were ranked based on the priority of agricultural development using the Technique for Order of Preference by Similarity to Ideal Solution (TOPSIS) method. And they concluded that the most suitable areas are mainly located in the north where villages are specializing in agricultural production. Prioritizing suitable agricultural areas helps land use planning and urban management [7]. In areas such as the study area of Qom, due to the lack of rainfall in recent years, there is no significant surface water and groundwater provides a major part of the water used in the agricultural sector. Water scarcity and successive droughts as well as the lack of permanent surface flows in the catchment area of the region have caused the aquifers in this area to form the main source of water needs in the region. Also, as a result of the overexploitation of groundwater resources, there have been certain changes such as a sharp and continuous drop in the water level, a negative balance and a sharp increase in the reservoir deficit, the quality of water become unfavorable in terms of drinking, industry and agriculture. As a result of withdrawing this volume from groundwater sources, the level of the Qom Plain has dropped by 34.5 meters in the last 43 years (September 1973 to August 2017) and on average, it has dropped by 0.8 meters per year. Therefore, it is necessary to adopt limited water resource management policies to reduce the amount of exploitation and compensate for the deficit of aquifers, increase productivity and economic production and finally reduce the gap between the exploitation rate and the renewal rate of aquifers. Based on this, the present study intends to adjust and modify the cultivation pattern of the study area of Qom-Kahak in such a way that at the end of the first five years, the programmable water notified by the Ministry of Energy and at the end of the fourth five years the long-term cumulative deficit of the aquifer is compensated. In general, the main goal of the current research is to formulate the optimal pattern of crop cultivation with an emphasis on the stability and dynamics of groundwater resources and to achieve sustainable agricultural indicators in the study area of Qom-Kahak.
Research method
Water supply and demand management plays an important role in the agricultural sector. The agricultural lands of the study area of Qom-Kahak are among the areas that in recent years have suffered excessive use of groundwater resources, water quality reduction and aquifer deficit due to the lack of proper management in the distribution of agricultural water consumption. Therefore, the purpose of this research is to investigate the status of groundwater stability and management of water consumption and distribution by providing water price policies and reducing the amount of water available on lands by developing an optimal cultivation pattern to manage changes in the groundwater level using fuzzy ideal planning. In this regard, according to Figure 1, which is the flowchart of the methodology of conducting this research, in the first step, after collecting the statistics and information of the region, according to the investigations, among the three scenarios A1B, A2 and B1 of the HADCM3 climate model and two scenarios A1B and B1 of the BCM2 climate model, the output of scenario A2 of the HADCM3 climate model is more compatible and logical for Qom province. Therefore, the rainfall component of this scenario has been used in the aquifer balance and for recalibration, it has been used to determine the components of the balance model and the water allocated to the sector. In the following, different scenarios are evaluated by considering different criteria and finally, the outputs of the proposed cultivation model are presented.

Figure 1: Research methodology.
Area of study
The study area of Qom, with an area of 1843 km², is located between UTM coordinates, 3844000 and 3779000 latitudes and 455000 and 473000 longitudes, in the 39th northern zone, which includes the Qom plain and the heights of Kahak. In the current study, the development of the optimal cultivation pattern will be done in a 20-year horizon in such a way that in 5 years, the current water consumption of agricultural wells in the study area (about 178 MCM) will be the amount of water that can be programmed (101 MCM). The reduction and long-term cumulative deficit of the study area aquifer (536 MCM) should be compensated in the next 15 years. Based on this, the water year 2017-2018 will be considered as the base year and the water year 2018-2019 to 2037-2038 as the planning horizon period (Figure 2).

Figure 2: The location of the Qom-Kahak study area.
Information on the composition of the cultivation pattern of major agricultural and horticultural crops in the study area of Qom-Kahak was obtained for the water years 2016-2017 and 2017-2018 and the average area of these two years was considered as the composition of the current cultivation pattern of the study area. Statistics and information on the technical coefficients of crop production in the region were collected by completing questionnaires and face-to-face interviews with farmers (Table 1). To be flexible in the search space of the decision-making model in the proposal of agricultural products, in addition to the existing agricultural products, four autumn fodder products, quinoa, cumin, sesame and beetroot were also investigated. According to the information obtained from the previous studies, there are 1582 traditional livestock farms in the villages of the study area, which include 100,745 light livestock and 11,510 heavy livestock. In this study, the coefficients of 0.75 and 5.375 respectively were used to convert the number of light and heavy livestock in the area into livestock units, based on which the number of light and heavy livestock in the study area is equivalent to 75559 and 61866 livestock units, respectively. It is estimated the conversion coefficients of products into the amount of digestible food are presented in Figure 3. To formulate the optimal cropping model of the study area, it is tried to adjust and change the current cropping pattern as much as possible so that in addition to meeting other technical limitations, meeting the food needs of livestock in the area is also included as a limitation in the modeling.
| Row | Crop | PM | RA | B | C | GM | W | L | MA | IS | FEch |
|---|---|---|---|---|---|---|---|---|---|---|---|
| 1 | Barley | 1.3 | 3800 | 4796 | 1477 | 3319 | 1150 | 10.6 | 6.6 | 2.1 | 250 |
| 2 | Hay | 1 | 10433 | 10433 | 3282.2 | 7151 | 9250 | 19.8 | 23.2 | 3.5 | 350 |
| 3 | Wheat | 1.35 | 4267 | 6750 | 1877.9 | 4872 | 2010 | 12.3 | 7.3 | 2.6 | 300 |
| 4 | Fodder corn | 0.25 | 37900 | 9475 | 2573.1 | 6902 | 7480 | 16.3 | 12.6 | 3.5 | 500 |
| 5 | Leafy vegetables | 0.7 | 27800 | 19460 | 9094.7 | 10365 | 4880 | 49 | 11.5 | 2.5 | 400 |
| 6 | Canola | 2.9 | 1967 | 6333 | 1808.09 | 4525 | 2610 | 11.4 | 7.6 | 2.7 | 350 |
| 7 | Watermelon | 0.45 | 33000 | 14850 | 5423.2 | 9427 | 7150 | 32.7 | 12.3 | 3.7 | 450 |
| 8 | Melon | 0.75 | 17500 | 13125 | 3838.53 | 9286 | 6350 | 30.4 | 12.1 | 3.6 | 400 |
| 9 | Cotton | 3.05 | 2450 | 7473 | 2529.5 | 4943 | 9280 | 26.2 | 7.3 | 3.95 | 350 |
| 10 | Fodder beet | 0.3 | 47650 | 14295 | 4618.26 | 9677 | 9290 | 31 | 17.6 | 3.9 | 450 |
| 11 | Cantaloupe | 0.55 | 26500 | 14575 | 4906.23 | 9669 | 6350 | 26.1 | 10.7 | 3.3 | 400 |
| 12 | Sunflower | 3.8 | 1875 | 7125 | 2866.63 | 4258 | 7500 | 31.3 | 7.6 | 1.8 | 300 |
| 13 | Millet | 3.2 | 1850 | 6216 | 1337.64 | 4878 | 3800 | 9.2 | 5.6 | 1.5 | 225 |
| 14 | Quinoa | 3.8 | 2200 | 8800 | 2494.82 | 6305 | 1895.5 | 13.2 | 8.3 | 2.8 | 300 |
| 15 | Cumin | 6.5 | 1000 | 6500 | 2087.2 | 4413 | 1992.6 | 15.5 | 6.2 | 2 | 150 |
| 16 | Sesame | 8.5 | 700 | 5950 | 1645.9 | 4304 | 4190.2 | 18 | 5.9 | 2 | 150 |
| 17 | Autumn beet | 0.3 | 39708 | 11913 | 4591 | 7321 | 3440 | 28.3 | 16 | 3.2 | 450 |
Note: PM: Farm price of each product in terms of ten thousand Rials per Kg; RA: Yield of each crop (kg/he); B: Gross income of each product in terms of ten thousand Rials per hectare; C: Current investment costs of each product in terms of ten thousand Rials per hectare; GM: Program yield of each product in terms of ten thousand Rials per hectare; W: Net water requirement of each crop in m3 per hectare; L: The labor required for each product in terms of person-days per hectare; MA: Working hours of machinery required for each product in hours per hectare; IS: Pesticides required for each product in liters per hectare; FECh: Chemical fertilizers required for each product in kg.
Table 1: Technical coefficients of crop production.

Figure 3: Conversion factor of products into Total Digestible Nutrients (TDN).
Water balance of the study area
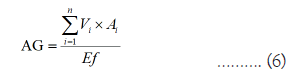
To achieve the most important goal of the study, which is the stability and balancing of the groundwater resources within the scope of the study, first of all, it is necessary to determine the coefficients, parameters and contribution of the balance factors, and especially the amount of water that can be allocated annually to the agricultural sector and based on that, to propose optimal agricultural patterns. Based on this, it is necessary to recalibrate the coefficients of the balance equation, including the coefficient of direct permeability of rainfall and surface flows, the return coefficient of the volume of water used for agriculture, drinking and industry in the region, etc. Then, these coefficients to compile the groundwater balance of the study area and determine the volume of water that can be allocated annually to the agricultural sector and finally propose the optimal cultivation model according to the mentioned volume in the planning horizon. To check the changes in the aquifer volume storage and the role of input and output factors, it is possible to use the continuity equation of the groundwater balance, which is presented in the annual time scale as equations (1) to (14):
ΔG = inflow - outflow …………. (1)
inflow = I + qin …………. (2)
outflow = C + qout …………. (3)
C = Cagg + Cags + Cd + Cin + Eg …………. (4)
I = Ip + Irs + Iagg + Iags + Id + Iin …………. (5)
Cagg = AG - Cags …………. (7)
Q = β × P …………. (8)
Ip = α1 × P …………. (9)
Irs = α2 × Q …………. (10)
Iagg = α3 × Cagg …………. (11)
Iags = α4 × Cags …………. (12)
Id = α5 × Cd …………. (13)
Iin = α6 × Cin …………. (14)
In these equations, ∆S changes in groundwater storage (changes in aquifer volume), I total amount of feeding, which includes Ip direct feeding due to precipitation, Irs feeding due to surface flows and river beds, Iagg and Iags feeding due to the return flow of water use. Agriculture, respectively from underground and surface sources, Id and Iin, respectively from the return flow of drinking water and industry, C total groundwater consumption, which includes Cagg, agricultural consumption from deep and semi-deep wells, Cags, agricultural consumption from springs and aqueducts, Cd and Cin. According to drinking and industrial uses from groundwater sources, qin and qout, respectively the input and output of groundwater to the plain aquifer area, Eg evaporation from the surface of the groundwater, according to the depth of the water table in the area, which is more than 5 meters, evaporation from the water table. It is assumed zero, Q is the runoff caused by rainfall, n is the number of agricultural and garden crops in the study area, Vi is the net annual water requirement of the i-th crop in the national water document (m3 per hectare), Ai is the cultivated area of the i-th crop (hectare). Ef is irrigation efficiency, AG is the total gross volume of irrigation required for the range, Cagg is the total agricultural consumption from groundwater sources, Cags is the total agricultural consumption from surface water sources, a1 to a6 and B are the coefficients of the balance equation, which are determined by calibration. The average efficiency of agricultural irrigation in the current state of the region according to the total amount of agricultural discharge from agricultural wells, springs and aqueducts and surface water consumption, the total net requirement of the agricultural and horticultural cultivation pattern in the area, as well as the opinions of the experts of the Organization of Agricultural and Water Jihad in the region. It is considered about 50%. The information related to the different uses of groundwater in the years 2013-2014 and 2015-2016, as well as the results of previous regional water studies, are used to determine and recalibrate the balance coefficients and parameters. The changes in the storage volume of the aquifer are estimated based on the Darcy equation as equation (15):
ΔG = Ss × Δh × A …………. (15)
where ∆S is the average changes in the level of the aquifer (in meters), Ss and A are respectively the average specific water discharge and the area of the aquifer, which are 0.04 and 478.04 km², respectively, Qom Plain, it should be noted that to calibrate the coefficients of the balance equation, the criterion of minimizing the error of the calculated aquifer volume changes from the balance equation and the observed values obtained from the hydrograph of the aquifer unit of the range was used. Considering the deficit volume of the region’s reservoir (536 MCM) and the fact that the proposal not to cultivate some water-intensive horticultural crops is facing serious opposition in the region, it seems that the only way to balance the balance without harming the income and employment of the farmers in the region is in one horizon. In twenty years, the increase in the efficiency of irrigation in the garden and agricultural sector is in addition to the modification and adjustment of the cultivation pattern in the agricultural sector. For this purpose, it is necessary to consider the balance equations dynamically and to estimate the amount of rainfall in the next 20 years to estimate the water supply. Then, according to the annual reduction targeted to balance the balance, the amount of water allocated to the agricultural sector is determined. In the future, efforts will be made to use the amounts of water allocated to the agricultural sector to propose optimal patterns of annual cultivation in the planning horizon with minimal changes and adjustments to the current pattern of the area. The proposed cultivation patterns will be developed in the first five years of the planning period to achieve the programmable water quantities notified by the Ministry of Energy and the remaining fifteen years to compensate for the long-term deficit of the aquifer and emphasize the indicators of agricultural sustainability. The current efficiency of the study area is 50%, which is expected at the end of the planning horizon due to the implementation of modern irrigation systems and the correct management of the operation of these systems, as well as the control of their operating hours by the regional water company to improve 75%. According to the investigations carried out among the three scenarios A1B, A2 and B1, the climate model Hadley Coupled Atmosphere-Ocean General Circulation Model (HADCM3) and two scenarios; A1B and B1. The climate model BCM2, the output of scenario A2 of the climate model HADCM3 is more compatible and logical for Qom province. Therefore, the rainfall component of this scenario was used in the watershed balance.
Optimization approach
Competing and conflicting goals to achieve sustainable development of agriculture include improving economic-social benefits (increasing or stabilizing the net income of farmers and employment of agricultural labor) and environmental benefits (reducing the consumption of water resources, fertilizers and chemical pesticides). For this purpose, multi-objective planning models are used and one of the methods to solve it is ideal planning. In the present study, ideal planning models will be used and for more flexibility of the model, a fuzzy ideal planning model will be used to achieve multiple goals at the same time and propose the optimal model of crop cultivation. In various studies, the theoretical model of fuzzy ideal planning model has been mentioned several times, therefore, for a better understanding of the considered limitations and ideals, only the empirical model of fuzzy ideal planning will be mentioned, which is in the form of equations 16 to 34:
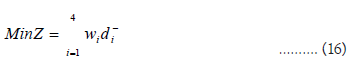
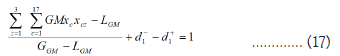
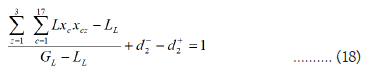
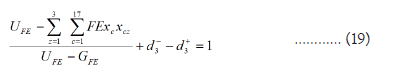
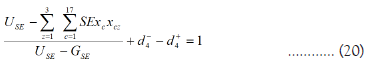
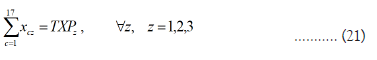

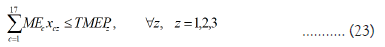

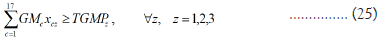
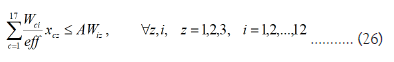
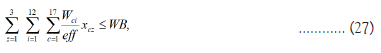
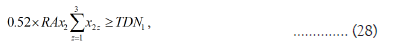
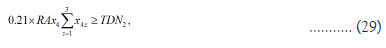
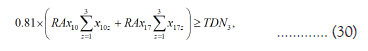
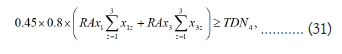
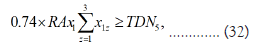
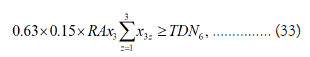

In the above equations, C is the index related to different crops, which include C=1 barley, alfalfa, wheat, fodder corn, leafy vegetables, canola, watermelon, melon, cotton, spring fodder beet, cantaloupe, sunflower, millet, quinoa, cumin, sesame and autumn fodder beet C=17, Z is the index related to the center of the agricultural sector located in the study area, which includes the center Kahak, respectively and the index is related to the months of the year. Also, XC is the cultivated area of the m product, Wci is the total net water requirement of the m product in the i-th month, GMc program efficiency, FEc chemical fertilizers, SEc chemical toxins, Lc labor, MEc machine working hours, Cc current costs required per hectare, RAc yield. The product of c and AWiz is the total water available in the I month in the z area. Also, TXPz is the total land, TMEPz is the total machine hours and TCPz is the total available capital in the region, which is calculated by solving a calibrated linear programming model due to the lack of statistics and information. TDN1 to TDN6 total fodder and nutritional needs of light and heavy livestock of the study area are alfalfa, fodder corn, fodder beet, wheat straw and barley, barley and wheat bran in terms of tons-TDN. D+ and d_i^- are positive and negative deviation variables in the fuzzy ideal programming model. In the above experimental model, equation (16) represents the objective function of the model, which is a linear function of weighted deviation variables and the considered weights represent the priority of achieving the desired goals. Equations (17) to (20) are respectively related to the ideal limits of increasing program efficiency and labor force employment and reducing the consumption of fertilizers and chemical poisons. Equation (21) is the limit of land and shows that the total cultivated areas of the proposed patterns of each region should be equal to the total cultivated area of that region and no unused land should remain. Equation (22) is the limitation related to the minimum and maximum area under cultivation of crops in different regions, which has been tried as much as possible with the least possible changes compared to the previous year. The equations up to (25) are related to the limits of machine working hours, current investment costs and program returns, respectively. It means that the total machine working hours and the capital requirement of the proposed model are lower and the total program efficiency is higher than the existing values in each region and the current minimum income of the farmers in each region is maintained. Equation (26) is related to the limitation of water available monthly in all three regions and different months, the total water consumption of the proposed cultivation pattern should not exceed the current situation of each region. Equation (27) is related to the limit of the total agricultural water consumption and the total water consumption of crops in different months of the entire Qom-Kahak area should be equal to the targeted water for balancing the balance. It should be noted that the irrigation efficiency of the area is about 50.2%, which is considered to increase by about 1.5% annually.
Table 2 shows the rescaled coefficients of the balance equation. Based on these coefficients of the components of the groundwater balance, the study area was determined, the results of which are presented in Table 3. It can be seen that the error rate of the changes in the aquifer volume estimated from the balance equation and the observed values based on the hydrograph of the aquifer unit is insignificant (1.74 MCM). Based on this, assuming that the recalibrated coefficients are constant in the planning horizon, these coefficients have been used to check the changes in the groundwater level based on the climatic conditions governing the study area and to propose cropping patterns. In addition, the amount of infiltration from drinking and industrial water consumption, underground inflow to the aquifer and surface water consumption, springs and aqueducts for agriculture were assumed to be constant in the planning horizon. Other components of the balance, such as infiltration from rainfall and riverbed and agricultural use, are variable. First, based on the output of the A2 scenario of the HADCM3 climate model, the amount of rainfall during the forecast planning horizon and then the infiltration components of the rainfall and the river bed have been determined and used in the groundwater balance model of the study area (Table 4). Also, the penetration rate of agricultural groundwater consumption is assumed to be variable and it will decrease in proportion to the increase in irrigation efficiency during the planning horizon. The amount of water that can be allocated to agriculture separately and the percentage of its reduction in the planning horizon are presented in Table 5. The Table of water consumed from the surface and underground sources in the current cultivation pattern are 295 MCM, of which 251 MCM are supplied from groundwater sources (178 from deep and semi-deep wells and 73 from springs and aqueducts) and 44 MCM from surface water sources. To reduce the extraction of groundwater resources (agricultural wells) from 178 to 101 MCM of programmable water as notified by the Ministry of Energy, the amount of extraction from agricultural wells at the end of the fifth year must decrease by 43% compared to the base year. It can be seen that one of the important goals of the study, which is to achieve this volume of extraction from deep and semi-deep wells (programmable water) at the end of the fifth year, has been achieved. To achieve the goals of programmable water (the end of the fifth year) and to compensate for the long-term deficit of the aquifer (the end of the 20th year), the amount of water consumed in the current cultivation pattern of the agricultural sector should be reduced from 295 to 218 and 165 MCM, respectively. In addition, the amount of water consumed by the agricultural and garden sector in the current conditions is 133.6 and 161.4 MCM, respectively, which should be reduced to 74.3 and 144 MCM at the end of the fifth year and to 48.5 and 116.4 MCM at the end of the period. The amount and percentage of changes in agricultural water consumption of the study area in the planning horizon according to the reducing sources are presented in Table 6. As mentioned earlier, in the garden sector, only the scenario of increasing irrigation efficiency is proposed and in the agricultural sector, in addition to increasing efficiency, efforts will be made to replace the current crop cultivation pattern with the optimal cultivation pattern. The results of Table 6 show that Table is the year of the planning horizon, with a 1.5% increase in irrigation efficiency in the horticultural and agricultural sector, as well as the modification of the crop cultivation pattern, in the agricultural sector, 15.7 MCM, equivalent to a 5.3% reduction in water resources consumption, will occur. Of this 5.3 percent reduction in consumption, the role of improving the garden and agricultural efficiency will be 1.2 and 1.1 percent, respectively, the modification of the crop cultivation pattern without changing the irrigation efficiency will be 3 percent and the improvement of crop efficiency with the modification of the crop cultivation pattern will be 4.1 percent. It can be seen that the modification and suggestion of the optimal pattern of crop cultivation will have the greatest contribution and will play a key role in reducing the consumption of water resources.
| α6 | α5 | α4 | α3 | α2 | α1 | β |
|---|---|---|---|---|---|---|
| Infiltration coefficient of industrial water consumption | Infiltration coefficient from drinking water consumption | Infiltration coefficient of surface consumption for agriculture | Infiltration coefficient of underground consumption for agriculture | Infiltration coefficient from riverbed bed | Direct infiltration coefficient from rainfall | Runoff coefficient |
| 0.35 | 0.75 | 0.365 | 0.365 | 0.13 | 0.106 | 0.07 |
Table 2: Coefficients of the water balance continuity equation of the Qom-Kahak area.
| Tank volume changes | Discharge components | Recharge components | The area of balance (Km²) | ||||||||||
|---|---|---|---|---|---|---|---|---|---|---|---|---|---|
| Hydrograph unit | Balance sheet continuity equation | Total discharge | Outflow underground flow | Well | Evaporation from the aquifer | Drainage | Fountain and aqueduct | Total recharge | Incoming underground flow | Drinking and industry | Agricultural water | Rainfall and surface currents | - |
| -22.08 | -20 | 294.06 | 0 | 221.2 | 0 | 0 | 72.93 | 273.72 | 58 | 77.24 | 107.4 | 13.057 | 478 |
Table 3: Components of the underground water balance of the study area in the base period (MCM).
| Agriculture (deep and semi-deep) | Agriculture (springs and aqueducts) | Agriculture (underground) | Agriculture | Garden | Farming | Year | ||||||
|---|---|---|---|---|---|---|---|---|---|---|---|---|
| Percentage reduction | Value | Percentage reduction | Value | Percentage reduction | Value | Percentage reduction | Value | Percentage reduction | Value | Percentage reduction | Value | |
| 0 | 178 | 0 | 73 | 0 | 251 | 0 | 295 | 0 | 161.4 | 0 | 133.6 | Base |
| 8.9 | 162.2 | 0 | 73 | 6.3 | 235.2 | 5.3 | 279.3 | 2.3 | 157.7 | 9 | 121.6 | 1 |
| 17.6 | 146.6 | 0 | 73 | 12.5 | 219.6 | 10.6 | 263.8 | 4.6 | 154 | 17.9 | 109.8 | 2 |
| 26.3 | 131.2 | 0 | 73 | 18.6 | 204.2 | 15.8 | 248.4 | 6.8 | 150.4 | 26.7 | 97.8 | 3 |
| 34.8 | 116 | 0 | 73 | 24.7 | 189 | 21 | 233.1 | 8.9 | 147.1 | 35.6 | 86.1 | 4 |
| 43.3 | 101 | 0 | 73 | 30.7 | 174 | 26.1 | 218.1 | 10.9 | 143.9 | 44.4 | 74.3 | 5 |
| 45.9 | 96.3 | 0 | 73 | 32.5 | 169.3 | 27.6 | 213.5 | 12.3 | 141.5 | 46.2 | 71.9 | 6 |
| 48 | 92.5 | 0 | 73 | 34.1 | 165.5 | 28.9 | 209.5 | 13.7 | 139.3 | 47.4 | 70.4 | 7 |
| 50.1 | 88.7 | 0 | 73 | 35.6 | 161.7 | 30.2 | 205.9 | 15 | 137.1 | 48.6 | 68.7 | 8 |
| 52.2 | 85.1 | 0 | 73 | 37 | 158.1 | 31.5 | 202.2 | 16.3 | 135.1 | 49.8 | 67.2 | 9 |
| 54.2 | 81.5 | 0 | 73 | 38.4 | 154.5 | 32.7 | 198.7 | 17.6 | 133.1 | 50.9 | 65.6 | 10 |
| 67.3 | 75.9 | 0 | 73 | 40.7 | 148.9 | 34.6 | 193.1 | 18.7 | 131.1 | 53.6 | 62 | 11 |
| 59.3 | 72.4 | 0 | 73 | 42.1 | 145.4 | 35.7 | 189.6 | 19.9 | 129.3 | 54.9 | 60.3 | 12 |
| 61.2 | 69.1 | 0 | 73 | 43.4 | 142.1 | 36.9 | 186.2 | 21 | 127.5 | 56 | 58.8 | 13 |
| 63.1 | 65.8 | 0 | 73 | 44.7 | 138.7 | 28 | 182.9 | 22.1 | 125.7 | 57.2 | 57.2 | 14 |
| 64.9 | 62.5 | 0 | 73 | 46 | 135.5 | 39.1 | 179.7 | 23.1 | 124 | 58.4 | 55.6 | 15 |
| 66.6 | 59.4 | 0 | 73 | 47.3 | 132.4 | 40.2 | 176.5 | 24.1 | 122.4 | 59.5 | 54.1 | 16 |
| 68.4 | 56.2 | 0 | 73 | 48.5 | 129.2 | 41.3 | 173.3 | 25.1 | 120.8 | 60.7 | 52.5 | 17 |
| 70.1 | 53.1 | 0 | 73 | 49.8 | 126.1 | 42.3 | 170.3 | 26.1 | 119.3 | 61.9 | 51 | 18 |
| 71.9 | 50.1 | 0 | 73 | 51 | 123.1 | 43.3 | 167.2 | 27 | 117.8 | 63 | 49.4 | 19 |
| 73.1 | 47.8 | 0 | 73 | 51.9 | 120.8 | 44.1 | 164.9 | 27.9 | 116.4 | 63.7 | 48.5 | 20 |
| 51.9 | 85.7 | 0 | 73 | 36.8 | 158.7 | 31.3 | 202.8 | 17.2 | 133.7 | 48.3 | 69.1 | Median |
Table 4: The amount of water allocated for agriculture (MCM) and its reduction percentage separately in the planning horizon.
| Percentage of changes separately | |||||||
|---|---|---|---|---|---|---|---|
| Improving crop efficiency and modifying crop cultivation pattern | Modifying the cropping pattern without changing the efficiency | Improving agricultural efficiency | Improving garden efficiency | Improving garden and crop efficiency and modifying crop cultivation pattern | Amount of changes (MCM) | Total agricultural consumption (MCM) | Year |
| - | - | - | - | - | - | 295/0 | Base year |
| -4/1 | -3/0 | -1/1 | -1/2 | -5/3 | -15/7 | 279/3 | 1 |
| -8/1 | -5/9 | -2/2 | -2/5 | -10/6 | -31/3 | 263/8 | 2 |
| -12/1 | -8/9 | -3/2 | -3/7 | -15/8 | -46/7 | 248/4 | 3 |
| -16/1 | -12/0 | -4/1 | -4/9 | -21/0 | -61/9 | 233/1 | 4 |
| -20/1 | -15/1 | -5/0 | -5/9 | -26/1 | -76/9 | 218/1 | 5 |
| -20/9 | -15/3 | -5/6 | -6/7 | -27/6 | -81/6 | 213/5 | 6 |
| -21/4 | -15/2 | -6/3 | -7/5 | -28/9 | -85/4 | 209/6 | 7 |
| -22/0 | -15/1 | -6/9 | -8/2 | -30/2 | -89/2 | 205/9 | 8 |
| -22/5 | -15/1 | -7/5 | -8/9 | -31/5 | -92/8 | 202/2 | 9 |
| -23/1 | -15/0 | -8/0 | -9/6 | -32/7 | -96/4 | 198.7 | 10 |
| -24/3 | -15/7 | -8/6 | -10/3 | -34/6 | -101/9 | 193/1 | 11 |
| -24/9 | -15/8 | -9/1 | -10/9 | -35/7 | -105/5 | 189/6 | 12 |
| -25/4 | -15/8 | -9/6 | -11/5 | -36/9 | -108/8 | 186/2 | 13 |
| -25/9 | -15/8 | -10/1 | -12/1 | -38/0 | -112/1 | 182/9 | 14 |
| -26/4 | -15/9 | -10/5 | -12/7 | -39/1 | -115/4 | 179/7 | 15 |
| -27/0 | -16/0 | -11/0 | -13/2 | -40/2 | -118/5 | 176/5 | 16 |
| -27/5 | -16/1 | -11/4 | -13/7 | -41/3 | -121/7 | 173/3 | 17 |
| -28/0 | -16/2 | -11/9 | -14/3 | -42/3 | -124/8 | 170/3 | 18 |
| -28/6 | -16/3 | -12/3 | -14/8 | -43/3 | -127/8 | 167/2 | 19 |
| -28/9 | -16/2 | -12/7 | -15/2 | -44/1 | -130/1 | 164/9 | 20 |
| -437/3 | -280/3 | -156/9 | -187/8 | -625/1 | -1844/4 | 4056/2 | Total |
| -21/9 | -14/0 | -7/8 | -9/4 | -31/3 | -92/2 | 202/8 | Median |
Table 5: Amount and percentage of changes in agricultural water consumption by reducing sources in the planning horizon.
| The average amount of products (percentage) | The present situation | Crop | |||||
|---|---|---|---|---|---|---|---|
| First period | Second period | Third period | Fourth period | Planning horizon | Cultivated area (hectares) | Amount (percentage) | |
| 51.8 | 53.1 | 54 | 53.6 | 53.1 | 9646 | 51.5 | Barley |
| 8.9 | 2.8 | 1.8 | 0.5 | 3.5 | 3516 | 18.8 | Alfalfa |
| 18.1 | 18.1 | 18 | 17.9 | 18 | 2711 | 14.5 | Wheat |
| 2.4 | 0.6 | 0.1 | 0 | 0.8 | 935 | 5 | Fodder corn |
| 6.8 | 11.7 | 12.1 | 12.2 | 10.7 | 664 | 3.5 | Leafy vegetables |
| 1.5 | 0.1 | 0 | 0 | 0.4 | 374 | 2 | Canola |
| 1.1 | 0 | 0 | 0 | 0.3 | 228 | 0.5 | Watermelon |
| 1.8 | 0/1 | 0 | 0 | 0.5 | 228 | 0.5 | Melon |
| 0.4 | 0 | 0 | 0 | 0.1 | 191 | 1 | Cotton |
| 0.6 | 0 | 0 | 0 | 0.1 | 122 | 0.7 | Spring fodder beet |
| 1.2 | 1.2 | 0.1 | 0 | 0.6 | 81 | 0.4 | Cantaloupe |
| 0 | 0 | 0 | 0 | 0 | 32 | 0.2 | Sunflower |
| 0.6 | 0.4 | 0 | 0 | 0.2 | 20 | 0.1 | Millet |
| 1.5 | 4 | 7.1 | 10.5 | 5.8 | 0 | 0 | Quinoa |
| 1.5 | 4 | 1.7 | 1.4 | 2.2 | 0 | 0 | Cumin |
| 0.2 | 0 | 0 | 0 | 0.1 | 0 | 0 | Sesame |
| 1.5 | 3.8 | 5.1 | 3.8 | 3.6 | 0 | 0 | Autumn fodder beet |
| 100 | 100 | 100 | 100 | 100 | 18748 | 100 | Total |
Table 6: Amount and share of proposed crops in the planning horizon.
At the end of the planning horizon, by improving the irrigation efficiency to 75% in the horticultural and agricultural sectors, as well as modifying the cropping pattern, 130 MCM, equivalent to 44.1%, will be reduced in the water resources consumption of the study area. Of this 44.1% reduction in consumption, the role of improving garden and agricultural efficiency will be 15.2% and 12.7% respectively, modification of cropping pattern without changing irrigation efficiency will be 16.2%, and improvement of cropping efficiency with modification of cropping pattern will be 28.9%. The average annual reduction of agricultural water consumption in the planning horizon is 92.2 MCM, which is equivalent to 31.3%, the role of improving garden and crop efficiency is 9.4% and 7.8% respectively and the modification of the cropping pattern without changing the irrigation efficiency is 14% and the improvement of cropping efficiency combined with the modification of the cropping pattern is 21.9%. It will be a percentage. The total reduction of water consumption in the planning horizon will be 1844.4 MCM, equivalent to 625.1%, of which 554.1 and 463 MCM, equivalent to 187.8 and 157%, respectively are related to improving the irrigation efficiency of the garden and agricultural sectors and 827 MCM, equivalent to 280.3%, are related to the modification of the cropping pattern without the change of irrigation efficiency and 1290 MCM is equivalent to 473.3% related to the improvement of agricultural efficiency along with the modification of crop cultivation pattern. The results clearly show the role and importance of improving and proposing the optimal pattern of crop cultivation in reducing the consumption of limited water resources and balancing the aquifer of the study area. In the following, the amount of water allocated to the agricultural sector will be used as a limitation of water resources in developing mathematical planning models, and an attempt will be made to suggest the optimal pattern of crop cultivation in different years of the planning horizon.
The main priority of the current research is to propose sustainable agricultural patterns with an emphasis on reducing the extraction of groundwater resources and balancing the aquifer. To achieve this, mathematical planning models and especially fuzzy ideal planning have been used. Therefore, by slightly changing and adjusting the current pattern of the region, appropriate and optimal patterns of crop cultivation in the 20-year planning horizon, taking into account the physical limitations of the land, cultivating strategic crops, monthly available water resources, providing forage and nutritional needs of livestock in the region, investment costs cash, available machine working hours, maintain the current income of farmers and achieve the goals of increasing or stabilizing the planned yield and labor employment and reducing the consumption of fertilizers and chemical poisons. In the proposal of agricultural patterns, it is important to pay attention to the fact that the changes in the cultivated area of selected crops should be done gradually, in such a way that, while achieving economic, social, and environmental goals, it also can be implemented and accepted by the users of the region. Considering the reduction of a large amount of water consumption to achieve the programmable water announced by the Ministry of Energy and to compensate for the long-term deficit of the aquifer, it is necessary to cultivate crops with high water requirements and reduce crops with lower water requirements; be replaced to review and analyze the results with the macro-planning periods of the country, the results of the proposed cultivation patterns, which were developed in a twenty-year time horizon, will be presented in four five-year periods and the average planning horizon. In Table 6 the amount and share of products and in Table 7 the amount and percentage of changes in the indicators of the proposed agricultural patterns in different periods of the planning horizon are presented. According to the latest statistics of the Qom Agricultural Jihad, the total area under irrigation in the Qom-Kahak Plain is 18,748 hectares and the crops of barley, alfalfa, wheat, fodder corn, leafy vegetables, rapeseed, watermelon, melon and cotton are 51.5, 18.8, 14.5 and 5 respectively. 3.5, 2, 1.2, 1.2 and 1% have the most cultivated levels. According to the prevailing conditions of the region and the water goals considered in the research, it seems that the cultivation of alfalfa, fodder corn, watermelon, melon and cotton crops has no technical justification. The results of Table 6 show that the physical productivity of water resources consumption in the current situation is 6954.5 Rials/m3, which means that on average, 695 Tomans of net income has been obtained per m3 of water resources consumption. In addition, the physical productivity of using chemical fertilizers is equal to 163300 Rials/kg, which shows that on average, 16330 Tomans of net income has been generated per kilogram of chemical fertilizers used. Similarly, the physical efficiency of using chemical poisons is equal to 1901500 Tomans per liter. The percentage of changes in the cultivated areas of the crops has been changing according to the amount of water allocated to the agricultural sector so in the early years of the planning horizon, these changes will be more and will gradually decrease towards the end of the period due to the approach of the existing cultivation pattern to optimal and stable conditions. As mentioned earlier, achieving 101 MCM of programmable water at the end of the first five years requires a 44.4% reduction in water consumption in the agricultural sector and 43.3% in deep and semi-deep wells.
| Changes compared to the base year (percentage) | Current situation | Indicator | ||||
|---|---|---|---|---|---|---|
| First period | Second period | Third period | Fourth period | Planning horizon | ||
| 0.07 | 0.12 | 0.03 | 0.06 | 0.07 | 92799.07 | Program profit (ten million Rials) |
| 5.33 | 12.75 | 13.22 | 11.33 | 10.66 | 283.72 | Employment (thousand people-working days) |
| -26.61 | -48.47 | -55.96 | -61.71 | -48.19 | 133.44 | Water resources (MCM) |
| -2.33 | -4.74 | -3.9 | -4.52 | -3.87 | 5681.45 | Chemical fertilizers (thousand kilograms) |
| -4.56 | -9.08 | -8.97 | -9.34 | -7.98 | 48.8 | Chemical poisons (thousand liters) |
| 40.53 | 94.51 | 127.47 | 161.7 | 106.06 | 695.45 | Physical productivity of water resources |
| 2.48 | 5.1 | 4.1 | 4.8 | 4.12 | 16.33 | Physical productivity of chemical fertilizers |
| 4.94 | 10.1 | 9.89 | 10.3 | 8.82 | 1901.5 | Physical productivity of chemical poisons |
Table 7: Amount and percentage of changes in the indicators of the proposed agricultural patterns in the planning horizon.
To achieve this important and other economic, social, and environmental goal in the proposed cropping pattern of the first period, the area under cultivation of wheat, leafy vegetables, melons, cantaloupe and millet, alfalfa, fodder corn, canola, watermelon, cotton and spring fodder beets should be increased. And sunflowers will decrease, barley will remain unchanged and crops with the potential to be planted in the region such as quinoa, cumin, sesame and fall fodder beets will increase somewhat. The results of the indicators of the proposed cultivation pattern of the first period of the planning horizon in Table 8 show that with the stabilization of farmer’s net income (planned yield), labor employment increased by 5.33 percent and the consumption of water resources, fertilizers and chemical pesticides decreased by 26.6, 2.33 and 4.56 percent, is showing respectively. Also, the physical productivity index of water resources consumption, fertilizers and chemical poisons have increased by 40.53, 2.48 and 4.94%, respectively and all the criteria and indicators are desirable and desired by the officials and policymakers. In the next periods of the planning horizon, the planting levels of barley, wheat, leafy vegetables, quinoa, cumin and autumn fodder beet will gradually increase and other crops will be gradually reduced and eliminated. The last column of the table shows the average share of the proposed products in the planning horizon. It can be seen that the cultivated levels of barley, wheat, leafy vegetables, millet, quinoa, cumin and autumn fodder beet increased compared to the base year and other crops decreased and were removed from the cultivation pattern of the region. The results of Table 7 also show the fact that in all the years of the planning horizon and without any change in the income of farmers, the consumption of water resources, fertilizers and chemical pesticides decreased and the employment of labor and the physical productivity of water resources, fertilizers and chemical pesticides increased. The average indicators in the planning horizon show that in addition to the stabilization of planned efficiency, labor force employment, physical productivity of water resources consumption, fertilizers and chemical poisons increased by 10.7, 106, 4.1 and 8.8 percent respectively and the consumption of water resources, fertilizers and chemical poisons increased by 48.2, respectively. It has decreased by 3.9 and 8%. Considering that the proposed models are proposed with minor adjustments and minimal annual changes and that all the economic, social and environmental indicators related to them are favorable, it seems that their acceptance and implementation by farmers, officials and experts can be done more easily.
| Wheat bran | Barley | Wheat and barley straw | Fodder beet | Fodder corn | Alfalfa | Planning horizon |
|---|---|---|---|---|---|---|
| 99.3 | 246.7 | 375.7 | 110.9 | 395.6 | 284.6 | Base year |
| 124.1 | 236.1 | 385.8 | 218.3 | 316.5 | 233.3 | 2018-2019 |
| 124.1 | 236.1 | 385.8 | 325.6 | 331 | 170.7 | 2019-2020 |
| 124.1 | 243.7 | 394.7 | 433 | 158.2 | 128.1 | 2020-2021 |
| 124.1 | 259.9 | 413.4 | 363 | 100 | 100 | 2021-2022 |
| 124.1 | 266.3 | 420.8 | 426 | 50 | 42.7 | 2022-2023 |
| 124.1 | 264.5 | 418.8 | 511.2 | 50 | 42.7 | 2023-2024 |
| 124.1 | 257.4 | 410.5 | 596.4 | 50 | 42.7 | 2024-2025 |
| 124.1 | 254.1 | 406.7 | 676.6 | 50 | 42.7 | 2025-2026 |
| 124.1 | 250.7 | 402.7 | 711.1 | 50 | 42.7 | 2026-2027 |
| 124.1 | 246.8 | 398.3 | 768.5 | 50 | 42.7 | 2027-2028 |
| 122 | 252.3 | 402.7 | 937.2 | 20 | 28.5 | 2028-2029 |
| 123.8 | 260.7 | 414 | 1022.4 | 20 | 28.5 | 2029-2030 |
| 124.1 | 264.3 | 418.6 | 980.4 | 0 | 28.5 | 2030-2031 |
| 124.1 | 262 | 415.9 | 715.3 | 0 | 28.5 | 2031-2032 |
| 124.1 | 255.6 | 408.4 | 648 | 0 | 22.8 | 2032-2033 |
| 124.1 | 256.7 | 409.7 | 647.1 | 0 | 18.5 | 2033-2034 |
| 124.1 | 256.7 | 409.7 | 647.1 | 0 | 18.5 | 2034-2035 |
| 121.4 | 260.9 | 412.1 | 715 | 0 | 12.8 | 2035-2036 |
| 122.4 | 259 | 410.9 | 690.7 | 0 | 7.1 | 2036-2037 |
| 124.1 | 253.2 | 405.7 | 573.3 | 0 | 0 | 2037-2038 |
| 123.8 | 254.9 | 407.3 | 630.3 | 62.3 | 54.1 | Average period |
Table 8: The percentage of meeting food and fodder needs of livestock units in the planning horizon.
The food and fodder requirements of livestock units (ton-) and their supply amount are presented in Figure 4. It can be observed that the current pattern of agricultural cultivation in the area is such that there is self-sufficiency in all the products used by the livestock units and it is faced with a surplus of production over the need. This surplus of production over the need for alfalfa and fodder corn products, which are part of water-consuming products, will be much more problematic. The minimum area under cultivation required for self-sufficiency in providing livestock needs for alfalfa, fodder corn, and spring fodder beet is 1235, 236 and 110, respectively and the total of barley and wheat is 7500 hectares. Fodder corn crops and especially alfalfa are among the water-consuming crops in the study area and without reducing their cultivated area, it will not be possible to achieve the quantitative goals of reducing water consumption. The percentage of meeting food and fodder needs of livestock units in the planning horizon is presented in Table 8. The results of Table 8 show that until the fourth year of the planning horizon, the proposed under-cropping levels of fodder corn and alfalfa products meet the livestock needs of the region. But from the fifth year, due to the limitation of water allocation for the agricultural sector, the suggested optimal levels of these two products will not meet the livestock needs of the region. In addition, the proposed cultivation patterns in all years of the planning horizon will be self-sufficient in meeting the needs of livestock for fodder beet, barley, wheat straw and barley and wheat bran products and even surplus will be produced. By increasing the area under cultivation of quinoa, it is possible to provide part of the livestock needs of the region, but it is necessary to provide the lack of livestock needs for alfalfa and fodder corn products from the provinces with the potential and comparative advantage of production, which should be the attention of the officials and planners of the region to be placed.

Figure 4: Food and fodder requirements of livestock units of the range (ton-TDN) and its supply percentage. 

In the following, we will analyze the effects of different scenarios, including continuing the current process of using water resources, improving the irrigation efficiency of both agricultural and horticultural sectors gradually from 50 to 75% in the planning horizon, and improving agricultural and horticultural efficiency along with the modification and proposal of the optimal model of crop cultivation. A study on the changes in the aquifer volume of the Qom-Kahak study area in the 20-year planning horizon, the results of which are presented in Figure 5. By examining the changes in the volume of the aquifer in the past 28 years and assuming the continuation of the current process of withdrawing from the aquifer in the study area, the situation of the changes in the volume of the aquifer in the next twenty years has been predicted, which can determine the dimensions of the problem to some extent. The prediction results indicate that if the current feeding and discharge process continues and no serious and practical measures are taken to reduce excessive withdrawal, the cumulative deficit of the aquifer will increase from the current situation of 536 MCM and will go up to 941 MCM at the end of the planning horizon. This problem can make the situation in the region more acute and cause harmful effects such as irreversible subsidence of the land, the inflow of saline currents and reduction of groundwater quality, reduction of water wells, an increase in pumping cost, etc. Also, with the decrease in production and the stagnation of the agricultural economy in the region, it is predicted that people’s livelihoods will face problems, and poverty, unemployment, delinquency and conflict over water will increase. Another scenario investigated in this research is maintaining the current cultivation pattern and reducing water consumption by developing modern irrigation systems and applying proper management and adequate monitoring so that the current efficiency of the region will gradually increase from about 50% in the current situation to 75% at the end of the planning horizon. The results of this scenario indicate that, provided that there is no increase in the cultivated area and the control of the amount of water extracted from agricultural wells, it is possible to control the groundwater loss and improve part of the aquifer deficit. Nevertheless, this amount of reduction is still far from the targeted amount of long-term deficit compensation of the range aquifer (536 MCM). Therefore, the third scenario of increasing the efficiency of irrigation in the horticultural and agricultural sectors, along with the modification and proposal of the optimal crop cultivation pattern to compensate for the long-term deficit of the aquifer at the end of the planning horizon and to achieve the 101 MCM of programmable water notified by the Ministry of Energy at the end of the fifth year, will be investigated. It can be seen that by increasing the irrigation efficiency and modifying the cultivation pattern and replacing the proposed crops with the current cultivation pattern of the study area, it will be possible to compensate for the long-term deficit of the aquifer and achieve sustainable agricultural indicators.

Figure 5: Aquifer storage changes in the study area in different scenarios. 

Due to the growing demand for water in different sectors on the one hand and the decrease in precipitation and its spatial and temporal imbalance on the other hand, water shortage is one of the basic problems of farmers in different regions. Indiscriminate extraction of groundwater sources also causes a significant decrease in the level of groundwater tables. It is necessary to plan for the optimal use of available water resources by introducing the appropriate cultivation pattern, taking into account maximum profit and minimum water consumption. Therefore, in this research, while presenting the optimal cultivation pattern and the optimal extraction rate from groundwater sources in the study area of Qom-Kahak, sustainable cropping patterns were presented in the framework of technical limitations by using fuzzy ideal planning models. The implementation of the proposed cultivation patterns in the planning horizon causes that, despite the stabilization of the planned yield (income) of the farmers and the balancing of the aquifer, the employment of the labor force and the physical productivity of the consumption of water resources, fertilizers and chemical poisons increase by 10.7, 106, 4.1 and 8.8 percent respectively. Water resources, fertilizers and chemical poisons should be reduced by 48.2, 3.9, and 8% respectively. Also, the proposed crop patterns, except alfalfa and fodder corn, are completely self-sufficient in meeting the fodder needs of livestock units in the study area from the fifth year of planning. Therefore, it is suggested that the authorities supply the shortage of livestock needs for hay and corn fodder products from the provinces with potential and relative advantage from the fifth year of the planning horizon so that the costs and the production cycle of the livestock units in the range do not suffer. In addition, the results show that by modifying the cropping pattern and replacing the products of the proposed cropping pattern with the current cropping pattern and increasing the irrigation efficiency of the study area, it will be possible to compensate for the long-term deficit of the aquifer along with achieving the indicators of sustainable agricultural development. Therefore, one of the basic requirements for achieving the quantitative goals of water consumption is the annual increase in the efficiency of irrigation systems. Therefore, it is suggested that the government provide the necessary facilities to the farmers and that the officials pay attention to the important point that the role of increasing efficiency in reducing water consumption is conditional on the installation of meters and control of farmers to prevent the increase of the cultivated area. Considering that the agricultural patterns with the least annual changes are proposed and all the economic, social and environmental indicators related to them are favorable, it seems that its acceptance and implementation by farmers, officials, and experts can be done more easily. Therefore, it is suggested that the policymakers prioritize the implementation of the proposed agricultural patterns, which requires the formulation of legal requirements, incentive and punishment policies, the employment of agricultural promoters, and the holding of educational and promotional classes and courses.
Chandra Shekhar Azad University of Agriculture and Technology, Kanpur, Uttar Pradesh 208002, is duly acknowledged for providing support and technical staff along with the labour during the experimentation.
Citation: Alizadeh F, Mohammadian F, Emamifar S, et al. Development of the optimal cultivation pattern to manage changes in the groundwater level using fuzzy ideal planning models (Study area: Qom-Kahak). AGBIR.2024;40(1):834-845.
Received: 05-Dec-2023, Manuscript No. AGBIR-23-121173; , Pre QC No. AGBIR-23-121173 (PQ); Editor assigned: 07-Dec-2023, Pre QC No. AGBIR-23-121173 (PQ); Reviewed: 25-Dec-2023, QC No. AGBIR-23-121173; Revised: 03-Jan-2024, Manuscript No. AGBIR-23-121173 (R); Published: 11-Jan-2024, DOI: 10.35248/0970-1907.24.40.834-845
Copyright: This open-access article is distributed under the terms of the Creative Commons Attribution Non-Commercial License (CC BY-NC) (http:// creativecommons.org/licenses/by-nc/4.0/), which permits reuse, distribution and reproduction of the article, provided that the original work is properly cited and the reuse is restricted to noncommercial purposes. For commercial reuse, contact reprints@pulsus.com This is an open access article distributed under the terms of the Creative Commons Attribution License, which permits unrestricted use, distribution, and reproduction in any medium, provided the original work is properly cited.