Agricultural and Biological Research
RNI # 24/103/2012-R1
Research Article - (2023) Volume 39, Issue 4
In absence of extensive testing for SARS-CoV-2, true prevalence of COVID-19 cases at Theni District in India remain unknown. This study examined the prevalence and risk factors of COVID-19 in Theni District, including active cases, discharge, mortality, blood groups, age, and sex-related factors wise COVID-19 positivity rate among patients with severe respiratory illness as reported by Theni medical college and hospital. RTPCR analysis was conducted at Theni Medical College and Hospital in Kanavilakku, Theni District, with 101,201 samples analyzed over the 2020-2022 time period. The highest COVID-19 incidence rates were seen in people aged 60 to 80, irrespective of sex or gender. Males had higher notification rates than females across all age groups.
COVID-19; SARS-CoV-2; MERS-CoV; Samples
A novel coronavirus (SARS-CoV-2) that originated form Wuhan, China, has been linked to the outbreak of severe respiratory infections in human first reported on December 31, 2019. SARS-CoV-2 has been linked to the outbreak of severe respiratory infections in humans, with 13,876,411 confirmed cases and 593,087 deaths in 216 countries. WHO characterized COVID-19 as a pandemic, and the Coronaviridae family is divided into Torovirinae and Coronavirinae.
Common human CoVs: HCoVs can cause common colds, upper respiratory tract infections, and lower respiratory tract infections [1].
Other human CoVs: SARS-CoV and MERS-CoV are more virulent and can cause epidemics.
This study examined the prevalence and risk factors of COVID-19 in Theni District, including active cases, discharge, mortality, blood groups, age, and sex-related factors.
Collection of data
RT-PCR identified 1,01,201 samples from Theni Medical College and Hospital in 2020-2022, with male, female, and transgender cases.
Sample collection
A swab is used to collect respiratory material in the nose for the COVID-19 PCR test, which is sealed and sent to a laboratory.
Extraction
Laboratory scientist receives the sample; they isolate (extract) genetic material from the rest of the material in the sample.
Test for COVID-19
Reverse Transcription Polymerase Chain Reaction (RT-PCR) Test:RT-PCR is a molecular test; this COVID-19 test detects genetic material of the virus using a lab technique called Reverse Transcription Polymerase Chain Reaction (RT-PCR). It involves the following steps.
Polymerase chain reaction (PCR): The RNA is reverse transcribed to DNA, and additional fragments of DNA are added. The mixture is then placed in an RT-PCR machine, which cycles through temperatures to create new copies of the target sections of viral DNA. This process usually goes through 35 cycles, creating 35 billion new copies of the sections of viral DNA.
RT-PCR tests measure the amount of fluorescence in a sample after each cycle to estimate the severity of the infection. Results may be available in minutes, but can miss some cases.
Computed tomography (CT) scan: Testing for COVID-19 is done using a special swab in the nose or back of the throat, which can take from one to several days to find out the results. Imaging tests, such as CT scans or chest x-rays, should not be used alone to diagnose or rule out COVID-19 [2].
Rapid antigen and antibody test: Rapid antigen and antibody tests are used to monitor personnel operating in at-risk environments or to carry out extensive screening strategies on populations where a new outbreak of infection is suspected. The swab buffer is loaded in the sample well and flows to the conjugation pad containing control rabbit antibodies and specific antibodies against SARS-CoV-2 antigens. In the case of a positive sample, the binding between antibodies immobilized in the test line and the antigen-conjugated antibody complex gives rise to a colorimetric reaction. In the case of a positive sample, the IgA, IgG or IgM-gold-tagged antigen complex binds to the human anti-antibodies immobilized in the test line, indicating a colorimetric reaction. Finally, the gold-tagged control rabbit antibodies flow to the control line binding anti-rabbit antibodies.
Immunoenzymatic serological test: ELISA is a colorimetric, chemiluminescent or fluorescent microwell plate-based assay used for the quantitation and detection of human proteins, immunoglobulins, antigens and other peptides. It allows researchers to obtain highly specific and sensitive results in a relatively short time. 96-well commercial COVID-19 ELISA indirect tests contain immobilized viral antigens that are recognized and bound by anti-SARS-CoV-2 antibodies. 96-well commercial COVID-19 ELISA sandwich tests contain immobilized antibodies against SARS-CoV-2 antigens at the bottom of each well able to bind antigens contained in the serum samples of patients.
Statistical analysis: The Results were expressed as Mean ± Standard error. All data were analyzed using statistical package for the social sciences 17.0 Software (SPSS Inc., Chicago, IL, USA).
COVID-19 affected patients reported 516 active cases, 12 discharge cases, 224 discharge cases and 10 fatalities in September 2020, the most of any month (Table 1 and Figure 1). COVID-19 affected patients had 4216 active cases, 1791 discharge cases, and 348 deaths in 2021, with the highest number in May and lowest in December (Table 2 and Figure 2). Active cases, discharge cases, and deaths for December 2022 were highest in January 2021, lowest in March 2022 and highest in January 2022 (Table 3 and Figure 3). Blood groups A+, AB+, B+ have significant impact on COVID-19 (Table 4 and Figure 4). COVID-19 was found most often in A+, AB+, B+, and B-blood groups in May 2021 (Table 5 and Figure 5). COVID-19 was found in B- and B+ blood groups in January 2022 (Table 6 and Figure 6). The lowest number of COVID-19 patients was observed in the 0-20 age group (Table 7 and Figure 7). In May 2021, the age group 40-60 (2447) had the highest incidence of COVID-19, while the lowest age group (0-20) had no cases. In January 2022, the age group 40-60 accounted for 792 cases, and in March 2022, the lowest age group (0-20) had no cases. COVID-19 is based on the distinct sexes, and is vetted at the level of January 2022 in Transgender (4) (Tables 8-12 and Figures 8-14).
| Month | COVID-19 | |||
|---|---|---|---|---|
| Active | Discharge | Death | Total | |
| March | 40 | 49 | 0 | 89 |
| April | 12 | 31 | 0 | 43 |
| May | 21 | 86 | 2 | 109 |
| June | 516 | 163 | 2 | 593 |
| July | 299 | 154 | 5 | 458 |
| August | 77 | 171 | 0 | 248 |
| September | 312 | 224 | 10 | 546 |
| October | 57 | 190 | 3 | 250 |
| November | 97 | 46 | 2 | 145 |
| December | 60 | 87 | 7 | 154 |
| Mean ± SE | 149.1 ± 53.236 | 120.1 ± 21.604 | 3.1 ± 1.048 | 263.5 ± 62.8580 |
| Correlation | 0.013 | 0.313 | 0.559 | 0.513 |
Table 1: Incidence of COVID-19 in 2020.
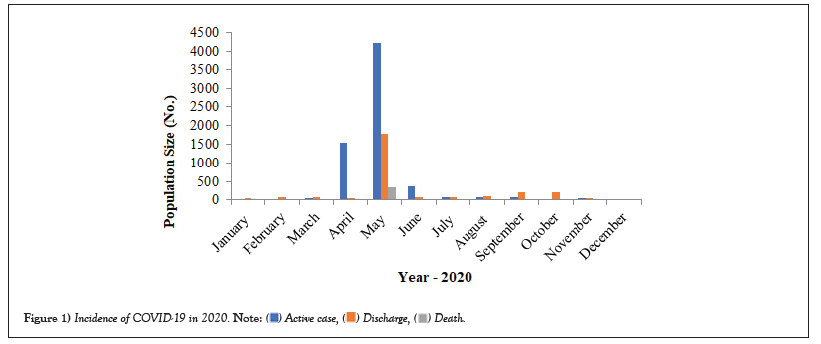
Figure 1: Incidence of COVID-19 in 2020. 
| Month | COVID-19 | |||
|---|---|---|---|---|
| Active case | Discharge | Death | Total | |
| January | 30 | 44 | 1 | 75 |
| February | 10 | 78 | 3 | 81 |
| March | 43 | 90 | 10 | 143 |
| April | 1547 | 53 | 6 | 1606 |
| May | 4216 | 1791 | 348 | 6355 |
| June | 363 | 76 | 2 | 441 |
| July | 83 | 74 | 2 | 159 |
| August | 86 | 96 | 3 | 185 |
| September | 87 | 209 | 2 | 298 |
| October | 32 | 220 | 4 | 266 |
| November | 53 | 55 | 0 | 108 |
| December | 18 | 30 | 2 | 50 |
| Mean ± SE | 547.33 ± 356.047 | 234.67 ± 142.549 | 31.92 ± 28.745 | 813.92 ± 1795.85 |
| Correlation | -202 | -96 | -141 | -172 |
Table 2: Incidence of COVID-19 in 2021.

Figure 2: Incidence of COVID-19 in 2021. 
| Month | COVID-19 | |||
|---|---|---|---|---|
| Active case | Discharge | Death | Total | |
| January | 1197 | 1513 | 6 | 2746 |
| February | 16 | 34 | 3 | 53 |
| March | 15 | 28 | 1 | 44 |
| Mean ± SE | 409.33 ± 393.833 | 525 ± 494.00 | 3.33 ± 1.453 | 947.67 ± 899.17 |
| Correlation | -866 | -868 | -993 | -867 |
Table 3: Incidence of COVID-19 in 2022.

Figure 3: Incidence of COVID-19 in 2022. 
| Month | Blood group | |||||||
|---|---|---|---|---|---|---|---|---|
| A+ | A- | B+ | B- | AB+ | AB- | O+ | O- | |
| March | 11 | 16 | 18 | 17 | 12 | 9 | 4 | 2 |
| April | 8 | 4 | 5 | 8 | 6 | 9 | 1 | 3 |
| May | 14 | 11 | 15 | 19 | 18 | 8 | 8 | 6 |
| June | 185 | 40 | 100 | 40 | 140 | 13 | 50 | 25 |
| July | 78 | 47 | 73 | 79 | 66 | 84 | 18 | 13 |
| August | 74 | 22 | 25 | 13 | 60 | 15 | 24 | 15 |
| September | 76 | 72 | 114 | 58 | 102 | 74 | 32 | 18 |
| October | 51 | 24 | 47 | 30 | 28 | 49 | 9 | 12 |
| November | 33 | 25 | 39 | 13 | 19 | 6 | 4 | 6 |
| December | 26 | 19 | 27 | 48 | 11 | 5 | 8 | 10 |
| Mean ± SE | 55.6 ± 16.7 | 28 ± 6.3 | 46.3 ± 11.8 | 32.5 ± 7.3 | 46.2 ± 14.2 | 27.2 ± 9.55 | 15.8 ± 95 | 11 ± 2,26 |
| Correlation | 0.057 | 0.285 | 0.232 | 0.281 | 0.005 | 0.159 | 0.017 | 0.266 |
Table 4: COVID-19 prevalence in 2020 regarding blood group.
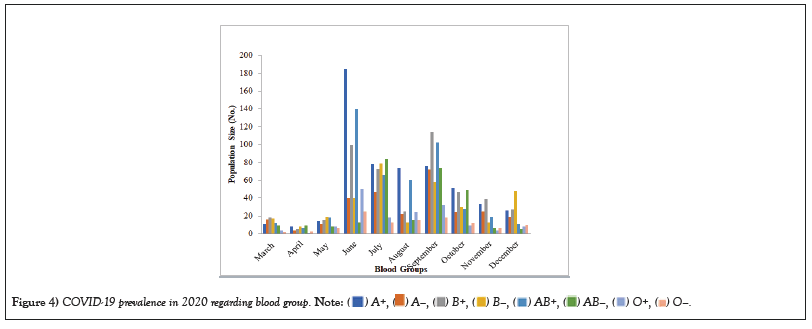
Figure 4: COVID-19 prevalence in 2020 regarding blood group. 
| Month | Blood group | |||||||
|---|---|---|---|---|---|---|---|---|
| A+ | A- | B+ | B- | AB+ | AB- | O+ | O- | |
| January | 11 | 10 | 7 | 16 | 10 | 14 | 3 | 4 |
| February | 17 | 14 | 6 | 4 | 21 | 17 | 8 | 2 |
| March | 24 | 25 | 20 | 22 | 19 | 17 | 6 | 10 |
| April | 295 | 272 | 266 | 288 | 163 | 195 | 55 | 72 |
| May | 947 | 895 | 1064 | 997 | 792 | 55 | 450 | 493 |
| June | 70 | 66 | 63 | 72 | 41 | 72 | 27 | 35 |
| July | 25 | 21 | 25 | 23 | 19 | 29 | 7 | 10 |
| August | 31 | 29 | 32 | 25 | 21 | 17 | 11 | 19 |
| September | 51 | 39 | 52 | 35 | 31 | 41 | 21 | 28 |
| October | 42 | 34 | 47 | 42 | 39 | 41 | 11 | 10 |
| November | 19 | 17 | 16 | 14 | 11 | 15 | 8 | 8 |
| December | 9 | 8 | 10 | 11 | 7 | 4 | 0 | 1 |
| Mean ± SE | 128 0 ± 77.7 | 119 ± 73.55 | 134 ± 86.98 | 129 ± 81.99 | 97 ± 64.25 | 98 ± 58.1 | 50 ± 36.5 | 57 ± 39.9 |
| Correlation | -0.571 | 0.565 | 0.613 | 0.576 | 0.6 | 0.576 | 0.642 | 0.642 |
Table 5: COVID-19 prevalence in 2020 regarding blood group.
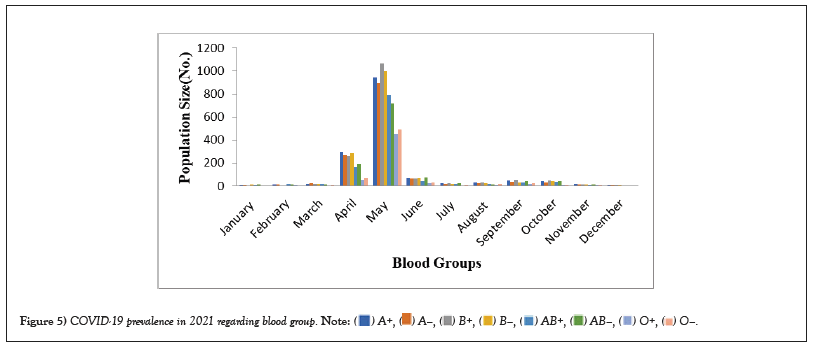
Figure 5: COVID-19 prevalence in 2021 regarding blood group. 
| Month | A+ | A- | B+ | B- | AB+ | AB- | O+ | O- |
|---|---|---|---|---|---|---|---|---|
| January | 326 | 218 | 503 | 550 | 416 | 472 | 125 | 136 |
| February | 11 | 10 | 8 | 10 | 8 | 5 | 1 | 0 |
| March | 9 | 8 | 11 | 7 | 5 | 4 | 0 | 0 |
| Mean ± SE | 115.33 ± 105.3 | 78.67 ± 89.66 | 174 ± 164.5 | 189 ± 180.5 | 143 ± 136.5 | 160.33 ± 155.8 | 42 ± 41.5 | 45.33 ± 45.33 |
| Correlation | -0.869 | 0.328 | 0.337 | 0.33 | 0.329 | 0.332 | 0.329 | 0.333 |
Table 6: COVID-19 Prevalence in 2022 regarding blood group.
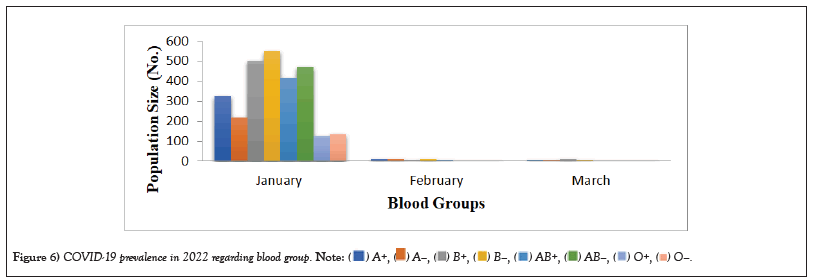
Figure 6: COVID-19 prevalence in 2022 regarding blood group. 
| Month | Age groups | ||||
|---|---|---|---|---|---|
| 0-20 | 20-40 | 40-60 | 60-80 | 80-100 | |
| March | 7 | 17 | 20 | 26 | 19 |
| April | 2 | 6 | 10 | 15 | 10 |
| May | 3 | 25 | 27 | 30 | 24 |
| June | 40 | 83 | 180 | 200 | 90 |
| July | 25 | 49 | 88 | 156 | 140 |
| August | 16 | 79 | 13 | 100 | 42 |
| September | 50 | 92 | 156 | 180 | 68 |
| October | 8 | 41 | 90 | 49 | 62 |
| November | 4 | 35 | 53 | 48 | 5 |
| December | 7 | 11 | 49 | 77 | 10 |
| Mean ± SE | 16.2 ± 5.32 | 43.8 ± 9.88 | 68.6 ± 18.89 | 88.1 ± 21.48 | 47 ± 13.74 |
| Correlation | 0.065 | 0.168 | 0.224 | 0.181 | -0.038 |
Table 7: Age related changes in COVID-19 (2020).
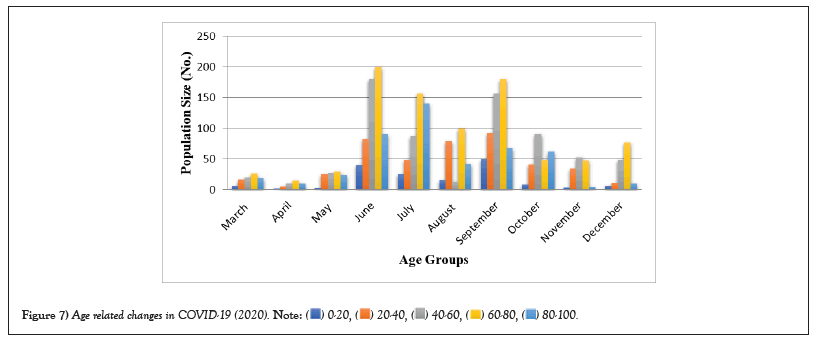
Figure 7: Age related changes in COVID-19 (2020). 
| Month | Age groups | ||||
|---|---|---|---|---|---|
| 0-20 | 20-40 | 40-60 | 60-80 | 80-100 | |
| January | 5 | 26 | 21 | 14 | 9 |
| February | 7 | 24 | 19 | 20 | 11 |
| March | 11 | 33 | 39 | 47 | 15 |
| April | 218 | 364 | 516 | 352 | 156 |
| May | 672 | 1045 | 2447 | 1596 | 595 |
| June | 46 | 84 | 136 | 112 | 63 |
| July | 21 | 34 | 42 | 35 | 27 |
| August | 24 | 35 | 47 | 49 | 30 |
| September | 40 | 67 | 74 | 69 | 48 |
| October | 40 | 63 | 66 | 59 | 38 |
| November | 17 | 20 | 31 | 29 | 11 |
| December | 5 | 11 | 13 | 21 | 0 |
| Mean ± SE | 98.17 ± 55.324 | 150.5 ± 85.877 | 287.58 ± 200.32 | 200.25 ± 129.63 | 83.58 ± 166.35 |
| Correlation | -0.169 | -0.193 | -0.169 | -0.165 | -0.167 |
Table 8: Age related changes in COVID-19 (2021).
| Month | Age groups | ||||
|---|---|---|---|---|---|
| 0-20 | 20-40 | 40-60 | 60-80 | 80-100 | |
| January | 236 | 660 | 792 | 743 | 315 |
| February | 7 | 10 | 11 | 19 | 6 |
| March | 5 | 9 | 13 | 10 | 7 |
| Mean ± SE | 82.67 ± 76.66 | 226.33 ± 216.83 | 272 ± 260.0 | 257.33 ± 242.84 | 109.33 ± 102.83 |
| Correlation | 0.329 | 0.332 | 0.335 | 0.327 | 0.335 |
Table 9: Age related changes in COVID-19 (2022).
| Month | Sex | ||
|---|---|---|---|
| Male | Female | Transgender | |
| March | 54 | 35 | 0 |
| April | 30 | 13 | 0 |
| May | 69 | 38 | 2 |
| June | 382 | 197 | 14 |
| July | 243 | 185 | 30 |
| August | 181 | 56 | 11 |
| September | 244 | 216 | 96 |
| October | 138 | 91 | 21 |
| November | 71 | 64 | 10 |
| December | 82 | 65 | 7 |
| Mean ± SE | 149 ± 35.505 | 96 ± 23.595 | 19.1 ± 9.055 |
| Correlation | 0.067 | 0.202 | 0.292 |
Table 10: Sex related changes of COVID-19 in 2020.
| Month | Sex | ||
|---|---|---|---|
| Male | Female | Transgender | |
| January | 40 | 33 | 2 |
| February | 45 | 29 | 7 |
| March | 75 | 63 | 5 |
| April | 826 | 664 | 116 |
| May | 3445 | 2696 | 214 |
| June | 234 | 192 | 15 |
| July | 74 | 76 | 9 |
| August | 112 | 150 | 23 |
| September | 142 | 139 | 17 |
| October | 132 | 121 | 13 |
| November | 51 | 47 | 10 |
| December | 25 | 16 | 4 |
| Mean ± SE | 433.42 ± 280.94 | 352 ± 218.96 | 36.25 ± 18.458 |
| Correlation | -0.172 | -0.166 | -0.191 |
Table 11: Sex related changes of COVID-19 in 2021.
| Month | Sex | ||
|---|---|---|---|
| Male | Female | Transgender | |
| January | 1270 | 1232 | 244 |
| February | 21 | 27 | 5 |
| March | 26 | 14 | 4 |
| Mean ± SE | 439 ± 415.503 | 424.33 ± 403.851 | 84.33 ± 79.834 |
| Correlation | -0.864 | -0.871 | -0.868 |
Table 12: Sex related changes of COVID-19 in 2022.
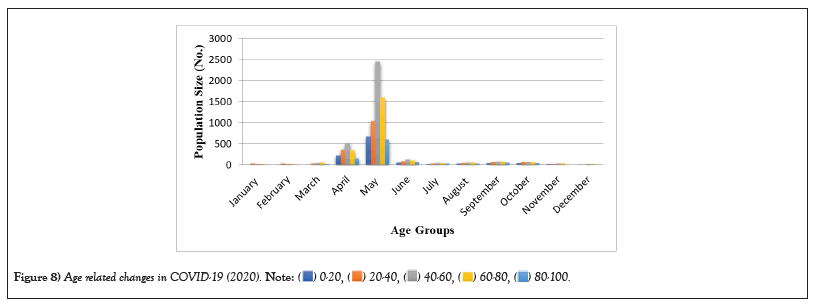
Figure 8: Age related changes in COVID-19 (2020). 
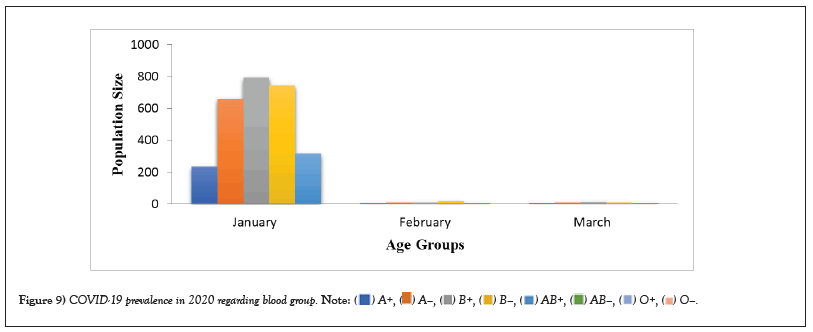
Figure 9: COVID-19 prevalence in 2020 regarding blood group. 
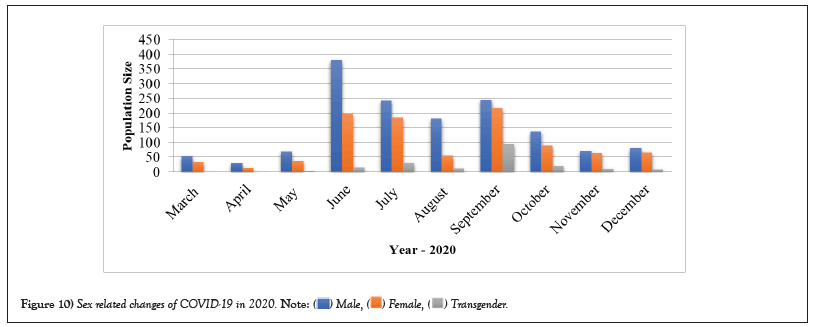
Figure 10: Sex related changes of COVID-19 in 2020. 
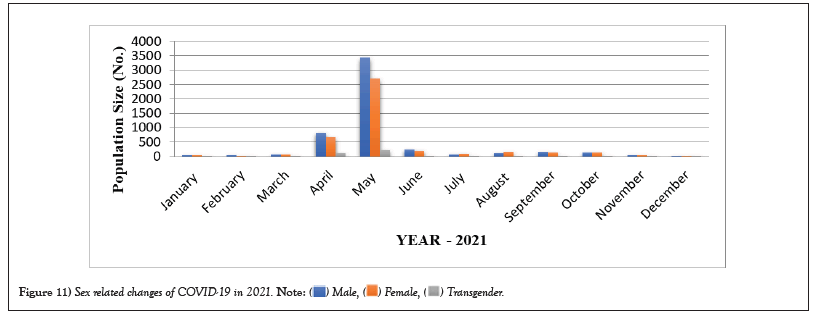
Figure 11: Sex related changes of COVID-19 in 2021. 
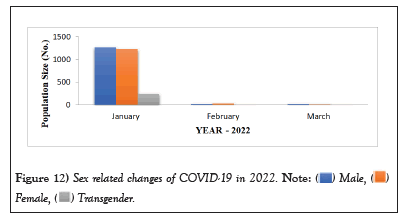
Figure 12: Sex related changes of COVID-19 in 2022. 

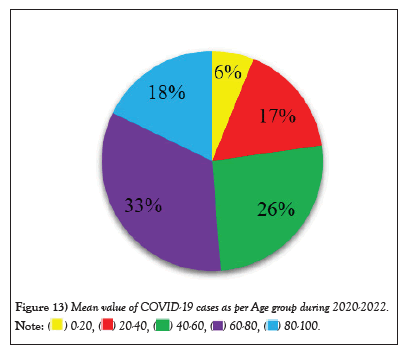
Figure 13: Mean value of COVID-19 cases as per Age group during 2020-2022. 
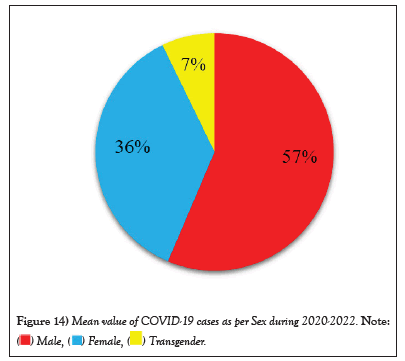
Figure 14: Mean value of COVID-19 cases as per Sex during 2020-2022. 

This rapid assessment of symptoms and symptom severity during an early phase of the COVID-19 pandemic provides important insights regarding SARS-CoV-2 infection in a community-based population not widely available in other data sources. Common symptoms were dry cough, fever, and shortness of breath/difficulty breathing. Factors predictive of testing positive for COVID-19 included modifiable and unmodifiable characteristics, such as symptoms, Black ethnicity, living in a home with someone experiencing COVID-19 symptoms, or recent international travel. Trouble waking up after sleeping was a predictor of a positive test result. Age and sore throat were identified as being predictive of a negative test result.
This study found that younger adults were more likely to be tested and report a positive COVID-19 test than other cohorts. Individuals with comorbidities, especially respiratory-related comorbidities, were at a higher risk of severe outcomes with SARS-CoV-2 infection. Disparities in access to healthcare may be an underlying factor contributing to these findings. A positive diagnostic test said they were 27% of individuals negative for COVID-19 antibodies, while 16% of the individuals who reported a negative diagnostic test reported a positive COVID-19 antibody test. Until effective therapies or vaccines become available, there are important strategies to build a stronger immune system and help prevent infection.
Self-reported survey data is subjective in nature, and mortality data is not reported. This study demonstrated that a community-based representative sample can be collected quickly to identify characteristics of individuals most likely to test positive for COVID-19. Analysis suggests substantial variation in individuals’ likelihood of transmitting, with no secondary infections linked to 71% of cases whose contacts were traced and tested. School closures and other non-pharmaceutical interventions may have contributed to reductions in contact among children, but social interactions among children may be conducive to transmission. The overall case fatality ratio is 2.1%, with lower relative incidence among older adults in Tamil Nadu and Andhra Pradesh.
The limited COVID-19 incidence and mortality among older adults in Tamil Nadu and Andhra Pradesh may be due to imperfect surveillance systems, case-based surveillance, and survivorship bias [1]. Prospective testing of a large sample of exposed individuals through integrated active surveillance and public health interventions provided an opportunity to characterize secondary attack rates, identify risk factors for transmission, and account for deaths outside of health care settings. However, several limitations should be considered, such as the lack of data on timing of exposure and onset of symptoms in relation to testing dates [2,3]. Data from two states of South India provided key insights into the local epidemiology and transmission dynamics of SARS-CoV-2, without competing with emergency response activities for limited resources. This study provided key insights into the local epidemiology and transmission dynamics of SARS-CoV-2 without competing with emergency response activities for limited resources [4].
Imperfect test sensitivity was attributed to inadequate sample collection procedures and low viral load in the upper respiratory tract, leading to an overall underestimate of transmission risk within case-contact pairs [5-7]. Surveillance and contact tracing are critical components of an effective public health response to COVID-19, and similar studies are necessary to inform the successful adoption of epidemic control measures in low-resource settings globally [8-15].
The development and use of Whole Inactivated Virus (WIV) and protein-based vaccines has been recommended, especially for use in developing countries. Affected people and those caring for someone infected should wear masks, proper hand hygiene is suggested, and respirators N95 or equivalent are recommended for healthcare workers. The WHO promotes ventilation and air filtration in public settings to remove infectious aerosols. Social distance (physical separation) refers to infection control measures that aim to delay disease transmission. Deep cleaning and other surface sanitation advice have been challenged as hygiene theatre.
Those who have been diagnosed with COVID-19 and those who believe they have been infected are advised to self-isolate at home. The Harvard T.H. Chan School of Public Health advocates a good diet, physical activity, stress management, and sufficient sleep.
[Crossref] [Google Scholar] [PubMed]
[Crossref] [Google Scholar] [PubMed]
[Crossref] [Google Scholar] [PubMed]
[Crossref] [Google Scholar] [PubMed]
[Crossref] [Google Scholar] [PubMed]
[Crossref] [Google Scholar] [PubMed]
[Crossref] [Google Scholar] [PubMed]
[Crossref] [Google Scholar] [PubMed]
[Crossref] [Google Scholar] [PubMed]
[Crossref] [Google Scholar] [PubMed]
[Crossref] [Google Scholar] [PubMed]
[Crossref] [Google Scholar] [PubMed]
Citation: Rani CS, Devi SP, Selvam SIK, et al. Prevalence of COVID-19 at Theni medical college and hospital in Kanavilakku, Theni district, Tamil Nadu, India. AGBIR.2023;39(4):605-613.
Received: 27-May-2023, Manuscript No. AGBIR-23-100246; , Pre QC No. AGBIR-23-100246 (PQ); Editor assigned: 31-May-2023, Pre QC No. AGBIR-23-100246 (PQ); Reviewed: 15-Jun-2023, QC No. AGBIR-23-100246; Revised: 29-Jun-2023, Manuscript No. AGBIR-23-100246 (R); Published: 06-Jul-2023, DOI: 10.35248/0970-1907.23.39.605-613
Copyright: This open-access article is distributed under the terms of the Creative Commons Attribution Non-Commercial License (CC BY-NC) (http:// creativecommons.org/licenses/by-nc/4.0/), which permits reuse, distribution and reproduction of the article, provided that the original work is properly cited and the reuse is restricted to noncommercial purposes. For commercial reuse, contact reprints@pulsus.com This is an open access article distributed under the terms of the Creative Commons Attribution License, which permits unrestricted use, distribution, and reproduction in any medium, provided the original work is properly cited.
