An International Journal
Agricultural and Biological Research
ISSN - 0970-1907
RNI # 24/103/2012-R1
RNI # 24/103/2012-R1
Research Article - (2022) Volume 38, Issue 1
A field experiment was conducted at Jimma Agricultural Research Center since the 2017 cropping season to evaluate the effect of NPSB fertilizer rate kg ha-1 (0,100,159,214, and 239) on proximate composition of three orange- fleshed sweet potato varieties (Kulfo, Tulla and Guntutie). The experiment was arranged in 3 X 5 factorial RCBD with three replications. Data on proximate values were collected and subjected to SAS data analyses. Results revealed that the main effects of varieties were highly significant influenced flour moisture content, fat, crude fiber, ash, crude protein, utilizable carbohydrate (P<0.01). Flower moisture content was highly significantly different in variety Guntutei (6.99%); however, it was statistical parity with Tulla (6.66%) variety. The least was scored by Kulfo (6.43%). Fat content was a highly significant difference in the variety Kulfo (1.45%) and found in the ranges of 1.28% to 1.45%. Crude fiber content was highly significantly different in variety Kulfo (6.99%) and the least was scored by variety Guntutei (6.20%). Ash content was a highly significant difference in variety Kulfo (4.67%) and the least was scored by variety Tulla (4.24%). Crude protein content was a highly significant difference in Variety Tulla (9.72%) and the least was scored by variety guntutei (8.36%). Utilizable carbohydrate content was a highly significant difference in variety Guntutei (72.6%) and the least was scored by variety Kulfo (71.26%). The main effects of NPSB rates were highly significant influenced crude fat, crude fiber, ash, crude protein, utilizable carbohydrate and gross energy (P<0.01). The interaction of varieties with NPSB blended fertilizer levels resulted in a significantly high difference in flour moisture, crude fat, crude fiber, ash and crude protein, utilizable carbohydrates (P<0.01). Flour moisture content was significantly highest different in variety Guntutie with 214 kg ha-1 (7.80%). The highest significant fat content was observed in variety Kulfo with 100 kg ha-1 (2.01%) and Guntutei with 159 kg ha-1 (2.04%). Crude fiber content was significantly highest different in variety Kulfo without fertilizer (8.99%). Ash content was significantly highest in Kulfo with 239 kg ha-1 (5.12%) NPSB blended fertilizers. Crude protein content was significantly highest in Tulla without fertilizer (12.64%). The mean of utilizable carbohydrate was recorded as significantly highest different by variety Tulla with 100 kg ha-1 (74.99%) and Guntutei with 159 kg ha-1 (74.83%). In conclusion, Kulfo variety was recommendable for its highest fat, fiber, and ash while Tulla for its protein content either alone or interactions with NPSB fertilizer rates.
Ash; Fat; Fiber; Flour moisture; NPSB rates; Protein; Utilizable carbohydrate; Variety
Central Statistics Authority (CSA); Days after Planting (Di- ammonium phosphate) (DAP); Food and Agricultural Organization (FAO); Melkassa Agricultural Research Center (MARC); Ministry of Agriculture and Rural Development (MoARD); Marketable Storage Root Weight Per plant (MSRWP); Orange Fleshed Sweet Potato(OFSP); Storage Root Dry matter(SRDM); Weeks after Planting(WAP); World Food Program(WFO); Yellow Fleshed Sweet Potato(YFSP)
Globally sweet potato is the 7th most important food crop after wheat, rice, maize, potato, barley, and cassava [1]. In Africa, sweet potato is the 2nd most important root crop after cassava [2]. In Ethiopia, sweet potato is a food security and economically important food crop. It is the 2nd most important root crop after enset. The crop is mostly used for human consumption either alone or blended with other crops [3]. It is mainly grown by small scale and resource-poor farmers in the South Western, Eastern, Western, and Southern parts of Ethiopia. It is also a major subsistence crop in periods of drought [4].
Orange fleshed sweet potato (OFSP) varieties have high β-Carotene and can potentially reduce the effects of vitamin A deficiency. Currently, they are at high demand in all developing nations including Ethiopia[5]. They have different proximate content, dry matter, and β-carotene (Vitamin A) content [6]. Different flesh-colored sweet potatoes: purple-red, yellow, and white flesh colored varieties have different dietary fiber, ash, anthocyanin, total phenolic, flour moisture, starch and total antioxidant activity [7]. Fertilizers affect proximate composition and other qualities of sweet potato. Total yield and storage root dry matter was increased as a result of phosphorus application [8-10]. An increase in the rate of applied N to Sweet potato caused an increase in root N content and some of the application of Sulfur(S) caused the formation of more protein which has a nutritional advantage [11]. Applications of N and P to the optimum increase in protein contents [12]. Vosawai et al. [13] reported that, the effect of N fertilizer levels and varieties on carbohydrates and total sugar content. The highest moisture percentage in the leaves and the highest crude fiber in the storage root of sweet potato were recorded from inorganic fertilizer treatments [14]. All quality of sweet potato varieties was significantly increased with increasing P rate to the optimum level.
In Ethiopia, the average national yield of sweet potato is about 8 ton ha-1 which is low as compared to the world’s average production of 14.8 ton ha-1. The qualities of their proximate are also very low. The major causes of the low yield and quality are scarcity of information on the appropriate rates of fertilizer recommendations, low soil fertility, shortage of improved varieties having high nutritional value, pests, and others. Fertilizer use in Ethiopia on sweet potato seems very limited. Out of 54,017 hectares, only 1073 hectares (1.986%) were treated with 239.1 tons of DAP and 156 tons of Urea fertilizer. Splitting of sweet potato tuberous root due to Boron (B) deficiency can reduce the quality of marketable storage tuber yields by 40–60% [15]. Inadequate sulfur supply will not only reduce yield and crop quality but also, it will decrease N use efficiency and enhance the risk of N loss to the environment [16].
Abdissa et al. [17] reported that sweet potato yields up to 64.4 ton ha-1 by using appropriate agronomic practices. Boron (B) prevents the splitting of sweet potato tubers and increases marketable tuber yield. Adequate sulfur supply will increase yield, crop quality, N use efficiency, and reduce the risk of N loss to the environment. It also stimulates the uptake of micronutrients (Cu, Mn, Zn, Fe, and Ni) due to rhizosphere acidification as S oxidation occurs.
Currently, the ammonium fertilizer representatives, Sulfur and Boron containing blended fertilizers had been using in Ethiopia [18]. Even though some experiments had been conducted on a variety evaluation of OFSP in different areas of Ethiopia mainly on yield improvement, less emphasis was given to the proximate aspect. Several experiments were conducted to determine the response of sweet potato to inorganic and organic fertilizer rates in different parts of the country. But yield responses vary from variety to variety, fertilizer level, and from place to place. Regarding these, experiments were not reported on the effects of blended fertilizer on the proximate of OFSP in the Jimma area, southwest condition. To address the gaps, this experiment was conducted with the following objectives:
Objectives
• To assess the effect of blended fertilizer levels and varieties on proximate compositions of orange-fleshed sweet potato.
• To assess the interaction effect of blended fertilizer levels and varieties on proximate compositions of orange-fleshed sweet potato.
Descriptions of the study site
The experiment was conducted at Jimma Agricultural Research Center located 366 km Southwest of Addis Ababa. It is geographically located at latitude 7o46' N and longitude 36 o47’E having an altitude of 1750 m.a.s.l. The soil of the study area is Nitisol which is dominant with a pH of 5.3 [19]. The area receives mean annual rainfall of 1737 mm with a maximum and minimum temperature of 25.21°C and 12.21°C, respectively.
Description of experimental materials
Experimental materials were three nationally released orange-fleshed sweet potato varieties: Kulfo (LO-323), Tulla (CIP 420027) and Guntutie (AJAC-I), and five levels of NPSB blended fertilizer: 0, 100, 159, 214 and 239 kg ha-1, comprising a total of 15 treatment combinations. The element content of 100 kg NPSB were: N=18.9 kg, P2 O5=37.7 kg, S=6.95 kg and B=0.1 kg (Table 1). Fertilizer NPSB had recommended blanket recommendation for over 50% which is for 11 districts of Jimma zone, including experimental site. Uniform application of 45 kg N ha-1 (97.82 kg ha-1 Urea) to each treatment was applied by subtracting the amount found in the treatments of NPSB rate tested (Table 1), which is the optimum recommendation for sweet potato according to research.
Treatments and experimental design
The experiment was set as a 3 x 5 factorial arranged in a randomized complete block design with three replications. Layout was done considering the slope gradients. The land was divided into three equal blocks, each having 15 equal plots and received 15 treatment combinations. The distance between block was 1.10 m and 80 cm between plots. The gross plot size for each treatment was 2.4 m x 3.6 m (8.64 m2). Each plot had six ridges and 60 cm apart. The height of the ridge was 25 cm. The spacing between rows and plants was 60 cm x 30 cm respectively and each plot received 48 plants. The 15 treatments were assigned to each plot by random using SAS randomization. The treatment combinations were: Kulfo X 0, Kulfo X 100 kg ha-1, Kulfo X 159 kg ha-1, Kulfo X 214 kg ha-1, Kulfo X 239 kg ha-1, Tulla X 0, Tulla X 100 kg ha-1, Tulla X 159 kg ha-1, Tulla X 214 kg ha-1, Tulla X 239 kg ha-1, Guntutie X 0, Guntutie X 100 kg ha-1, Guntutie X 159 kg ha-1, Guntutie X 214 kg ha-1 and Guntutie X 239 kg ha-1 NPSB.
Pre-planting soil sampling and analysis
One composite soil sample was collected from a selected area of 47.2 m X 14.1 m, at the depth of 20 cm from a diagonal of 49.26 m in 2 ways at 10 m interval with a staring benchmark of 0.5 m out of the selected area. A uniform volume of soil was obtained in each sample by vertical insertion of an auger. Then, the soil sample was analyzed for its chemicals property (pH, OC, N, P, and OM) [20]. The organic matter was calculated by multiplying the result of OC by 1.73 (OM=OC *1.73). The samples were air-dried, ground using a pestle and a mortar and allowed to pass through a 2 mm sieve for organic carbon to pass through 0.2 mm sieve to remove the coarser materials. Soil laboratory analyses were made at Jimma Agricultural Research.
Procedures for pre-planting soil chemical analysis
Soil pH: was measured in a 1:2.5 (soil: water) ratio using a glass electrode pH meter by the method described by McLean [21].
Organic carbon: was determined by the modified Walkley and Black procedure as described by Olsen and Sommers [22].
Total nitrogen: was determined by the Kjeldahl digestion and distillation procedure as described by van Reeuwijk [23].
Available phosphorus: The readily acid-soluble forms of P were extracted with HC1:NH4 F mixture (Bray's No. II method) as described by Olsen and Sommers.
Pre-planting soil chemical properties result
The pre planting soil sample was resulted in pH of 5.11 which fall in classes of strongly acidic according to Scianna et al. [24] who classify soil acidity on the bases of crop tolerance and performance as ultra-acidic (pH<3.5), extremely acidic (pH=3.5 - 4.4), very strongly acidic (pH=4.5-5.0), strongly acidic (pH=5.1-5.5), moderately acidic(pH=5.6-6.0), slightly acid (pH=6.1- 6.5),neutral(pH=6.6-7.3), slightly alkaline (pH=7.4-7.8), moderately alkaline (pH=7.9-8.4),strongly alkaline (pH=8.5-9.0), and very strongly alkaline (pH>9.0).
It had total nitrogen of 0.117% which fall in low-class level according to the rating by Landon [25], who classified soils having total N of greater than 1.0% as very high, 0.5-1.0% high, 0.2-0.5% medium, 0.1-0.2% low and less than 0.1% as very low in total nitrogen content. Available phosphorus content was 3.923 ppm which was fall in low rate according to the rating by Karltun et al.[26], who described soils with available P content of <15 ppm as very low. The organic carbon was 2.447% which was a medium level according to the Netherlands commissioned a study by Ministry of Agriculture and Fisheries [27] which classify soil with organic carbon contents (%)>3.50, 2.51- 3.5, 1.26-2.50, 0.60-1.25 and <0.60 as very high, high, medium, low and very low respectively. Generally, analyzed soil result was fall in the class of low soil fertility and fertilizer use was the right way.
Treatment management
Vines of 30 cm long having 3 internodes were prepared from the top but not succulent one and lasted for 48 hours, before planting. Vines were planted on July 20, 2017; at 45 O slants on the prepared ridge and one-third of them were covered by soil or inserted in a ridge. Fertilizer NPSB was applied after 15 days of planting or after checking the success of survival vine and the remaining nitrogen rate was applied after 21 days after planting (DAP) in-ring placement in slight shallow made ring and covered by light fine soil. All agronomic practices were followed according to the recommendation (hoeing, earthling up, irrigation when necessary, weeding, pest, and disease protection).
Data collection procedures
Ten plants were tagged from each plot from four interior rows excluding the border. All yield and yield-related data were collected from sample plants. All data collections were done in the morning. Data for proximate samples were collected from a marketable yield of storage roots and prepared according to the laboratory recommendation. The samples were freshly chopped and dried partially by sun and then by oven dry method to 11% moisture content and grounded by machine to form flour sample for proximate values.
Data collected
Tuber grade: Tubers were graded into marketable by measuring root diameter from the middle portion of the storage root using Digital Calipers. Storage roots with a diameter of less than 3 cm (30 mm) were considered unmarketable, while those with a root diameter of 3 cm (30 mm) or more were considered as marketable roots [28].
Marketable Storage Root Weight ton per hectare (MSRY ton ha-1): was measured by hanging digital balance in kg from ten plants per plot and converted to ton per hectare.
Storage Root Dry Matter (SRDM): Samples from marketable categories of tubers were taken at random from each harvested plot, sliced, chopped, composited, and prepared to 100 gm fresh weight and dried in an oven-dry forced air circulation at 70 for 24-72 hours until they attained constant weight.

Crude fibre: Crude fibre was determined at Debre Zayt Agricultural Research Center (DZARC) using dilute acid and alkali hydrolysis using Fibered (2010) by Weende method using 1.5 g flour sample. The crude fiber was calculated and expressed as a percentage [29].
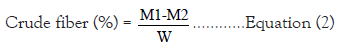
Where M1=mass of the crucible (the sand and wet residue); M2=mass of the crucible (the sand and ash); W=sample weight dry matter basis.
Determination of fat/lipid content
The fat content will be determined by the solvent extraction method using Soxtec TM 2055. About 3 g each of the samples will be taken into extraction thimble and covered with defatted cotton wool. The thimble support holder will be used to insert the thimbles into the extraction unit, then the cup holder will be used to insert the extraction cup containing 70 ml of solvent (40- 60°C petroleum ether). The extraction process will be involved three stages; boiling (15 min), rinsing (45 min), and recovery (10 min). The cup containing extracted fat will be dried in an oven at 105°C for 30 mins, cooled in a desiccator and

Where =Weight of fat (Wf)=Wa – Wb; WA= weight of extraction flask after extraction
WB=weight of extraction flask before extraction; SW=weight of samples
Ash content
The ash content was determined by AOAC method 923.03.at Melkassa Agricultural research center food quality laboratory.

Where M1=Weight of the dish; M2=Weight of fresh sample and dish; M3=Weight of ash and dish.
Moisture content (MC)
The flour moisture contents of the experimental samples were determined according to AOAC method 925.09 at Melkassa agricultural research center using about 5 g of the sample from each plot sample. Then, the moisture content was estimated by the following formula:

Where M1=mass of sample after drying; M2=mass of sample before drying
Determination of crude protein
Crude protein content of samples was determined by the micro-Kjeldahl method of nitrogen analysis as described by AOAC, method 988.05. At Jimma agricultural research center quality and Soil laboratory using 0.3 gm of the sample. Ultimately the percentage of nitrogen content was estimated using the following formula:

VA=volume (mL) of the HCl solution consumed in the sample titration; VB=volume (mL) of the standard solution used in the sample blank titration; N=Normality of hydrochloric used which was 0.1 N; W=weight of sample (g). The crude protein content was estimated using the formula.
Cp% =6.25*total nitrogen ….Equation (7)
Determination of utilizable carbohydrate
The utilizable carbohydrate was calculated by difference. The mathematical expression is as follow:
Utilizablecarbohydrate(%)=100-(%Crudefiber+%Crudeprotein+%Crudefa t+%TotalAsh+%Moisture)…………………………………………………Equation (8)
Gross energy
Gross energy was calculated according to the method developed by Osborne and Voogt [30]. The gross energy content the flour was calculated as follow:
Gross energy (kcal/100 g)=(9x% crude fat)+(4x% crude protein)+(4x% utilizable Carbohydrate) ………………Equation (9).
Data analysis
All data were subjected to analysis of variance (ANOVA) using the linear model (Lm) SAS statistical software package [31]. The total variability was detected using the following model:
Tijk=μ+Ri+Vj+Fk+(VF)jk+ε ijk ……………Equation (10)
Where=T ijk is the total variation for a given yield component, μ is the overall mean, Ri is the ith replication, Vj is the jth variety treatment effect, Fk is kth NPSB blended fertilizer level treatment effect, (VF)jk is the interaction between variety, and NPSB blended fertilizer level, and ε ijk is the variation due to random error.
The differences between the mean values were tested with Least Significant Difference (LSD) at 1% and 5% of probability level using GLM. Correlations of the variables were tested by SAS statistical software package.
Effect variety on crude fiber, crude fat, crude protein, ash, flour moisture content and utilizable carbohydrate and gross energy content of orange-fleshed sweet potato
The evaluated varieties resulted in highly significant difference (P<0.01) in flour moisture content, fat, crude fiber, ash, crude protein, carbohydrate, marketable yield ton ha-1 and storage root dry matter content.
Flower moisture content was highly significant difference in variety Guntutei (6.99%); however, it was statistical parity with Tulla(6.66%) variety. The least was scored by Kulfo (6.43%). This variation in the moisture content among the orange-fleshed sweet potato varieties can be due to the differences in the genetic composition and cultivation practices. In comparison with other roots and tubers, the sweet potato has high moisture content and thus, has a low dry matter content mainly of orange-fleshed sweet potato varieties.
Fat content was a high significant difference in variety Kulfo (1.45%) and it was statistically at par with variety Guntutei (1.41%). The least was scored by Tulla (1.28%). The fat content of this main effect ranges from 1.28% to 1.45%. In line with this, the mean fat values for the different varieties ranged from 1.1 to 2.0% were reported by Ukom et al. [32]. Another comparable to this value, 1.2 to 2.7% reported by Holloway et al. [33]. Alam et al. [34] reported that, fat content of sweet potato varieties varied from 0.17% to 0.63% which was by far lower to this experiment values. In line with variety Kulfo, Alam et al. reported that variety BARI SP5 showed an unusually higher content of fat (0.63%) than the other varieties. Another report indicated that the mean fat values for the different varieties ranged from 1.1 to 2.0%. Although these values were low, as compared to the values of 1.2 to 2.7% which were reported by Holloway?
Crude fiber content was a highly significant difference in variety Kulfo (6.99%) and the least was scored by variety Guntutei (6.20%) which was statistical parity with variety Tulla (6.58%). In line with this, Emmanuel et al. reported that, 4% crude fiber in OFSP and 5% crude fiber in YFSP flours. Afuape [35] reported that sweet potato is a good source of dietary fiber (2.5-3.3 g/100 gm) with important vitamins like vitamins A, C and B6, as well as potassium and iron. Variety King-J which is light OFSP scored average crude fibre of 1.47%, variety Mother’s Delight (UMUSPO/3) which is deep OFSP had crude fibre of 2% and variety UMUSP/2 which is pure WFSP scored mean crude fibre of 1.04% Afuape in Nigeria. The crude fiber content of this study ranged from 6.2% to 6.99% for three varieties. Lower dietary fiber was reported in the range of 0.30% to 0.54% which was reported by Alam et al. On the other hand, based on dry weight bases, Senanayake et al. [36] found in the range of 2.1% and 13.6% in Sri Lankan varieties. Orange fleshed sweet potatoes are the most important tubers in containing basic dietary fiber in addition to beta carotenes. Dietary fiber has been receiving much importance, as it is believed to reduce the incidences of colon cancer, diabetes, heart disease, and certain digestive diseases [37].
Ash content was a high significant difference in variety Kulfo (4.67%) and the least was scored by variety Tulla (4.24%). In line with this experiment, Emmanuel et al. reported that, 4% ash in OFSP and 3% ash in YFSP. Closer to this experiment, Afuape reported that variety King-J which is light orange- fleshed sweet potato scored average Ash content of 1.3%, variety Mother’s Delight (UMUSPO/3) which is a deep orange-fleshed sweet potato had Ash content of 15% and variety UM USP/2 which is pure white-fleshed sweet potato had mean of 15% Ash content in Nigeria. In this experiment, the ash content ranges from 4.24% to 4.67%. Close this experiment, Alam et al. reported that the ash content of the OFSP varieties ranged from 1.17% to 1.31%. Rose and Vasanthakaalam also reported that the ash content in the fresh sweet potato tubers was between 0.40% and 0.44% in their study. Ash content is the basic indicator of microelements which are the most important in the dietary of human being mainly of children and pregnant women. The low ash contents would mean that the sweet potato varieties might be low in some minerals.
Crude protein content was a high significant difference in Variety Tulla (9.72%) and the least was scored by variety guntutei (8.36%). The protein content was varying with variety. In line with this, high protein content was recorded in the BARI SP4 (5.83%) while it was least in the BARI SP6 variety (1.91%). Farther more, Woolfe [38] reported that the typical total protein content of sweet potato is as low as 1.5% fresh weight (FW) and as high as 5% dry weight (DW). The result of this experiment showed that the protein content range of 8.36% to 9.72% in DW basis which is by far higher than other sweet potato varieties reported.
Economic analysis of the treatments
T5 was the most economically profitable treatment while T3 was expensive compared to the other treatments. The BCR trends as follows: T5>T2>T1>T4>T0 >T3. In addition, the total expenditure was far below the total gross revenue implying a positive balance sheet for all the soil treatments. Compared to T0, T3 recorded the lowest gross revenue as well as the lowest marginal net returns and profit rate (-290%). Thus apart from T0, all the other treatments are profitable with T3 as the least and T5 the most profitable.
Utilizable carbohydrate content was a high significant difference in variety Guntutei (72.6%) and the least was scored by variety Kulfo (71.26%) which was statistical parity with variety Tulla (71.53%). It is obvious that sweet potato is rich in carbohydrates and high in most of the varieties. Farther more, the high carbohydrate content of the sweet potatoes makes it a good source of energy. Therefore, those varieties having high fat, fiber, and protein content may be low in carbohydrate and the vise verse is true.
There is no significant difference between gross energy content. Marketable yield (53.03 ton ha-1) was a high significant difference in variety Guntutei and the least was scored by variety Kulfo (36.6 ton ha-1) which was statistical parity with variety Tulla (38.42 ton ha-1). Dry matter content was a high significant difference in variety Tulla (31.29%) and the least was scored by variety Guntutei (26.86%). An agreement to this, Woolfe reported that the normal dry matter content is around 30%. The dry matter content differs widely depending on aspects such as variety, geographic area, and climate, amount of light, soil, fertilizer management, and cultivation practices.
Effect of blended fertilizer on flour moisture, crude fat, crude fiber, and ash and crude protein content and utilizable carbohydrate and gross energy content orange-fleshed sweet potato
The evaluated fertilizer rate resulted in high significant difference (P<0.01) in crude fat, crude fiber, ash, crude protein, utilizable carbohydrate, gross energy, marketable yield ton ha-1 dry matter and (P<0.05) in flour moisture content and ash (Tables 1 and 2).
| NPSB treatment rate | Element content | N added | Urea in kg | N Recommended | ||||
|---|---|---|---|---|---|---|---|---|
| Treatments | NPSB ha-1 | N | P205 (P) | S | B | |||
| Control | 0 | 0 | 0(0) | 0 | 0 | 0 | 0 | 0 |
| NPSB1 | 100 | 18.9 | 37.7(16.58) | 6.95 | 0.1 | 26.1 | 56.73 | 45 |
| NPSB2 | 159 | 30.07 | 60(26.4) | 11.06 | 0.159 | 14.93 | 32.45 | 45 |
| NPSB3 | 214 | 40.355 | 80.5 (35.4) | 14.83 | 0.21 | 4.645 | 10.09 | 45 |
| NPSB4 | 239 | 45.11 | 90(39.6) | 16.59 | 0.238 | 0 | 0 | 45 |
Table 1 : Rate of NPSB formulated and tested
| Fertilizer(NPSB) rate Kg ha-1 | Four moisture % | Crude fat % | Crude fiber % | Ash% | Crude protein% |
|---|---|---|---|---|---|
| 0 | 6.57ab | 1.40c | 7.11a | 4.35b | 9.77a |
| 100 | 6.74ab | 1.62a | 6.07b | 4.41ab | 8.48c |
| 159 | 6.78ab | 1.49b | 6.49b | 4.40b | 8.13c |
| 214 | 6.45b | 1.20d | 6.13b | 4.44ab | 9.24b |
| 239 | 6.99a | 1.15d | 7.01a | 4.60a | 9.83a |
| Mean | 6.71 | 1.37 | 6.56 | 4.44 | 9.09 |
| Cv | 7.47 | 6.31 | 8.18 | 4.56 | 5.26 |
| LSD | 0.48 | 0.08 | 0.52 | 0.2 | 0.46 |
Note: Means with the same letters in same columns are not significantly different N:Nitrogen, P: Phosphorus, S: Sulfur, B: Boron, %=Percentage, Kg ha -1=kilo gram per hectare , CV: Coefficient of Variations, LSD: Least Significance Difference
Table 2 : Effect of NPSB blended fertilizer on means of flour moisture, crude fat Crude fibre, ash and crude protein
Flower moisture content resulted significant difference at 239 kg ha-1 rate (6.99%); however, it was statistical parity with all rates except at 214 kg ha-1. Fat content was high significant difference at 100 kg ha-1(1.62%) and followed by 159 kg ha-1 (1.49%). The least was scored at the two higher rates. Crude fiber content was a high significant difference at 239 kg ha-1 rate (7.01%) and at zero rates (7.11) which were statistically at par with each other. Ash content was a high significant difference at the rate of 239 kg ha-1 (4.6%) which was statistically at par with 214 kg ha-1 (4.44%) and 100 kg ha-1 (4.4%) rates. In line with this, the application of fertilizer together with sufficient irrigation can influence the nutrient content of OFSP, especially the mineral content indicator which is ash [39]. Crude protein content was similar to fiber content and a high significant difference at the rate of 239 kg ha-1 (9.83%) and zero level (9.77%) which was statistical parity to each other.
Effect of blended fertilizer on utilizable carbohydrate, gross energy, storage root yield and dry matter content of orange-fleshed sweet potato
Utilizable carbohydrate, gross energy, storage root yield, and dry matter content resulted in significant Differences (p<0.01) (Table 3). Utilizable carbohydrate content was a high significant difference at rates of 100 kg ha-1, 159 kg ha-1, 214 kg ha-1 with the content of 72.69%, 72.71%, and 72.54% respectively. These were not statistically significantly different from each other. Gross energy calculated was resulted in significant difference in the rate of 100 kg ha-1 (339.21 kcal/100 g), however, it was statistical parity with 214 kg ha-1 (337.96 kcal/100 g) and 159 kg ha-1 (336.81 kcal/100 g). Marketable yield was a high significant difference at the rate of 159 kg ha-1 (52.74 ton ha-1) and the least was scored at zero rates (33.08 ton ha-1). Dry matter was a high significant difference at the rate of 159 kg ha-1 (32.73%) and the least was scored at controle (23.55%). In line with this, Boru et al. reported that the highest percentage of dry matter response at 69 kg ha-1 P2 O5 and the least dry matter was recorded at control. Increased P level from 0 to 25 P kg ha-1 resulted in increased root dry matter over the control by 46% g per hill on ridge.
| Fertilizer Rate(NPSB) Kg ha-1 | Utilizable carbohydrate % | Gross energy Kcal/100 g | Marketable yield ton ha-1 | Storage root dry matter % |
|---|---|---|---|---|
| 0 | 70.80b | 334.88b | 33.08d | 23.55d |
| 100 | 72.69a | 339.21a | 40.88c | 28.40c |
| 159 | 72.71a | 336.81ab | 52.74a | 32.73a |
| 214 | 72.54a | 337.96a | 41.98c | 31.47ab |
| 239 | 70.42b | 331.33c | 46.77b | 30.29b |
| Mean | 71.83 | 336.04 | 43.09 | 29.29 |
| Cv | 1.11 | 0.76 | 7.95 | 5.96 |
| LSD | 0.77 | 2.48 | 2.05 | 1.68 |
Note: Means with the same letters in same columns are not significantly different N: Nitrogen, P :Phosphorus, S:Sulfur, B :Boron, %:Percentage, Kg ha-1 : kilo gram per hectare , Kcal:kilo calorie, g:gram, CV: Coefficient of Variations, LSD: Least Significance Difference
Table 3 : Effect of NPSB blended fertilizer on means of utilizable carbohydrate, gross energy, storage root yield and dry matter content of orange-fleshed sweet potato
Interaction effects of varieties and blended fertilizer levels on proximate of orange fleshed sweet potato
Flour moisture, crude fat, crude fiber, ash and crude protein content: The interaction of variety with NPSB blended fertilizer resulted in a significantly highest difference in flour moisture, crude fat, crude fiber, ash, and crude protein content (P<0.01) (Table 4). Flour moisture content was significantly highest different in variety Guntutie with 214 kg ha-1(7.80%). This did not significant different from 100 kg ha-1(6.97%), 239 kg ha-1 (7.43%); Tulla without NPSB (7.28%), 159 kg ha-1 (7.45) and Kulfo with 100 kg ha-1 (7.63%). Emmanuel et al. reported that, 17% flour moisture in OFSP and 15% in YFSP. Therefore, agronomic practices and variety affect the moisture content of sweet potato.
| Interactions(Variety*NPSB) | Flour moisture % | Crude fat % | Crude fiber % | Ash % | Crude protein % |
|---|---|---|---|---|---|
| Kulfo X 0 kg ha-1 | 5.80fgh | 1.48b | 8.99a | 4.48bcd | 9.13cde |
| Kulfo X 100 kg ha-1 | 7.63ab | 2.01a | 6.95cd | 4.53bc | 8.89cde |
| Kulfo X 159 kg ha-1 | 6.37efg | 1.39bc | 5.98ef | 4.69b | 9.59bc |
| Kulfo X 214 kg ha-1 | 5.42h | 1.11e | 5.82ef | 4.65b | 8.92cde |
| Kulfo X 239 kg ha-1 | 6.85bcde | 1.18de | 8.30ab | 5.12a | 9.59bc |
| Tulla X 0 kg ha-1 | 7.28abcd | 1.34bc | 5.26 f | 4.15 de | 12.64a |
| Tulla X 100 kg ha-1 | 5.63gh | 1.35bc | 5.60f | 4.48bcd | 7.95f |
| Tulla X 159 kg ha-1 | 7.45abc | 1.06ef | 7.82bc | 4.02e | 8.36ef |
| Tulla X 214 kg ha-1 | 6.15efgh | 1.34bc | 6.69de | 3.96e | 9.13cde |
| Tulla X 239 kg ha-1 | 6.74cde | 1.30 cd | 7.28 cd | 4.50bc | 10.33b |
| Guntutei X 0 kg ha-1 | 6.43defg | 1.41bc | 7.55bcd | 4.44bcd | 7.94f |
| Guntutei X 100 kg ha-1 | 6.97abcde | 1.49b | 5.66 f | 4.21cde | 8.60def |
| Guntutei X 159 kg ha-1 | 6.52def | 2.04a | 5.67 f | 4.50bc | 6.45g |
| Guntutei X 214 kg ha-1 | 7.80a | 1.17de | 5.87ef | 4.70 b | 9.65bc |
| Guntutei X 239 kg ha-1 | 7.43abc | 0.92f | 5.80ef | 4.40bcd | 9.32cd |
| Mean | 6.71 | 1.37 | 6.56 | 4.44 | 9.09 |
| CV | 7.55 | 6.45 | 8.08 | 4.47 | 5.28 |
| LSD | 0.86 | 0.15 | 0.9 | 0.34 | 0.81 |
Note: Means with the same letters in same columns are not significantly different N: Nitrogen, P:Phosphorus, S:Sulfur, B:Boron , %:Percentage, CV: Coefficient of Variations, LSD: Least Significance Difference
Table 4 : Interaction effect of OFSP varieties and NPSB blended fertilizer level on means of flour moisture, crude fat, crude fiber, ash and crude protein
The highest significance of fat content was observed in variety Kulfo with 100 kg ha-1 (2.01%) and Guntutei with 159 kg ha-1 (2.04%). It was followed by Kulfo without fertilizer(21.48%) and Guntutei with 100 kg ha-1(1.49%) which statistically at par with Kulfo with 159 kg ha-1 (1.39%), Tulla without fertilizer (1.34%), Tulla with 100 kg ha-1 (1.35%), Tulla with 214 kg ha-1 (1.34%) and Guntutie without fertilizer (1.41%). The least was observed in the interactions of Guntutei with 239 kg ha-1(0.92%) which was statistically at par with Tulla with 159 kg ha-1(1.06%). This experiment was revealed that flour moisture content varies with variety and interaction with fertilizer rates. It showed that there is an optimum fertilizer rate for specific varieties like Kulfo and Guntutie. The higher fertilizer rate resulted in the lowest fat content in all varieties evaluated in this experiment.
Crude fiber content was significantly highest different in variety Kulfo without fertilizer (8.99%), however, it did not significantly different from Kulfo with 239 kg ha-1 (8.30%). In this treatment, the application of NPSB fertilizer reduced the fiber content from 0 to 214 kg ha-1 with Kulfo (8.99 % to 5.82% and 0 to 239 kg ha-1 with Guntutie 7.55% to 5.66%). Inversely to this, NPSB from 0 to 159 kg ha-1 with Tulla resulted in increased crude fiber from 5.26% to 7.82% and even to higher interaction of fertilizer rates evaluated. Similar to this experiment, the highest yield for crude fiber was observed at the control for all the varieties except TIS8164 which highest value was observed at 40 N kg ha-1. This was also confirmed by the report of Igbo we et al. This revealed that non-synthetic input cropping system enhanced crude fiber more than the conventional (chemical- intensive) cropping system. Another report indicated that, the application of nitrogen fertilizer significantly decreased crude fiber in all the varieties evaluated by Ukom et al. From this experiment we can realize that the response of orange- fleshed sweet potato to fertilizer rates on the crude fat yield may be due to variety.
Ash content is the best reflection of the mineral content of the food material. Ash content was significantly highest in Kulfo with 239 kg ha-1 (5.12%) NPSB blended fertilizers. Following this, Kulfo with 159 kg ha-1 (4.69%), 214 kg ha-1 (4.65%), and Guntutie with 214 kg ha-1(4.70%) resulted in highest scores; however, they did not significantly differ from each other and statistically at par. The least was observed in the interactions of Tulla with 159 kg ha-1 (4.02%), 214 kg ha-1 (3.96%) which was statistically at par with Guntutie with 100 kg ha-1 (4.21%) and Tulla without fertilizer (4.15%). Ash content in Kulfo variety increased from 4.47% to 5.11% as NPSB increased from 0 to 239 kg ha-1, which was inverse to crude fiber in the same treatment interactions. In line with these, several authors reported that, an increased concentration of minerals in the sweet potato leaves and roots with the increased application of fertilizer [40]. Fertilizer and agronomic practices can influence total ash in the sweet potato varieties and one of the possible factors could be the use of fertilizers.
Crude protein content was significantly highest in Tulla without fertilizer or control (12.64%). Following this, Tulla with 239 kg ha-1 (10.33%) resulted in highest scores; however, it was statically parity with Kulfo with 159 kg ha-1 (9.59%), Kulfo with 239 kg ha-1 (9.59%) and Guntutie with 214 kg ha-1 (9.65%). The least was observed in the interactions of Tulla with 100 kg ha-1 (7.95%) and Guntutie without fertilizer (7.94%) which was statistically at par with Guntutie with 100 kg ha-1 (8.60%) and Tulla with 159 kg ha-1 (8.36%). Similar to this, the application of nitrogen above 80 kg ha-1 did not increase the yield of most nutrients (namely, β-carotene and protein). Inversely to this, the application of nitrogen fertilizer increased the mineral contents of most sweet potato varieties significantly in the range from 0-120 N kg ha-1. This author farther reported that, for most varieties, protein yield was best at 40-80 N kg ha-1 with TIS8710087 having the highest value of 9.84% at 80 N kg ha-1. The protein content of orange- fleshed sweet potato varieties response to blended fertilizer was at a higher level(rates) which may result in high protein yield per hectare and each variety may had an optimum rate of blended fertilizer. However, the protein percentage content per a given of orange-fleshed sweet potato varieties were not dependent on the blended fertilizer rate, the fertilizer’s rates influenced the total storage root yield which indirectly influenced Protein yield per hectare. Therefore, use of blended fertilizer is crucial for harvesting potential protein yield per hectare.
Utilizable carbohydrate, gross energy, marketable yield, and storage root dry matter content %
The interaction of varieties with NPSB blended fertilizer resulted in significantly highest difference (p<0.01) in utilizable carbohydrate, gross energy, marketable yield and storage root dry matter (Table 5). The mean of utilizable carbohydrate was recorded as significantly highest different by variety Tulla with 100 kg ha-1 (74.99%) and Guntutei with 159 kg ha-1 (74.83%) NPSB fertilizer. These were statistically at par with Kulfo with 214 kg ha-1 (74.09%). The least was scored by Kulfo with 239 kg ha-1 (68.98%) and Tulla without fertilize (69.32%). These were statistically at par to Kulfo without fertilizer (70.14%), Kulfo with 100 kg ha-1 (69.99%) and Tulla with 239 kg ha-1 (69.86%). Mean of utilizable energy was recorded as significantly highest different by variety Tulla with 100 kg ha-1 (343.90 Kcal/100 g) which was statistically at par to Guntutei with 100 kg ha-1 (340.11 Kcal/100 g), Guntutei with 159 kg ha-1 (343.48 Kcal/100 g), Kulfo with 214 kg ha-1 (342.00 Kcal/100 g) and Tulla with 100 kg ha-1 (343.90 Kcal/100 g). The least was observed by Kulfo with 239 kg ha-1 (324.87 Kcal/100 g) and Tulla with 159 kg ha-1 (328.15 Kcal/100 g). Almost all energy content was more critically dependent on utilizable carbohydrate and dry matter content. Mean of marketable fresh storage root yield ton per hectare was significantly highest different by variety Guntutie, that received 159 kg ha-1, 214 kg ha-1 and 239 kg ha-1 NPSB fertilizer (63.33 ton ha-1, 60.16 ton ha-1 and 63.44 ton ha-1) respectively. Following these, variety Kulfo and Tulla, which received 159 kg ha-1 NPSB fertilizer, scored 47.68 ton ha-1 and 47.21-ton ha-1 yield respectively, however, they did not significantly differ from each other and from Guntutie with 100 kg ha-1 NPSB which scored 46.67 ton ha-1 marketable yield. In line with this, El-Sayed et al. reported that P rates resulted in a significant effect on total marketable yield at 15, 30, and 45 kg /fed P2 O5 (15 .7 P kg ha-1; 31.42 P kg ha-1 and 47.1 P kg ha-1) on “Beaure Gard” cultivar of sweet potato. Similarly, Yeng et al. reported that, the sole inorganic fertilizer 30:30:30.N.P.K (200 kg ha-1) produced marketable storage root yield 76% more than the control, which can be very significant for a smallholder farmer in Guinea savanna.
| Interactions (Variety*NPSB) | Utilizable Carbohydrate % | Gross Energy Kcal/100g | MSRY ton ha-1 | SRDM % |
|---|---|---|---|---|
| Kulfo X 0 kg ha-1 | 70.14fgh | 330.35de | 28.68f | 24.23ij |
| Kulfo X 100 kg ha-1 | 69.99fgh | 333.62d | 35.26cde | 28.18efg |
| Kulfo X 159 kg ha-1 | 71.99cde | 338.79c | 47.68b | 33.48ab |
| Kulfo X 214 kg ha-1 | 74.09ab | 342.00abc | 32.34def | 33.23abc |
| Kulfo X 239 kg ha-1 | 68.98h | 324.87ef | 36.3cde | 27.25fgh |
| Tulla X 0 kg ha-1 | 69.32h | 339.93abc | 30.89ef | 25.05hi |
| Tulla X 100 kg ha-1 | 74.99a | 343.90a | 40.71c | 31.26bcd |
| Tulla X 159 kg ha-1 | 71.30def | 328.15ef | 47.21b | 35.40a |
| Tulla X 214 kg ha-1 | 72.73c | 339.49bc | 33.45def | 30.67bcde |
| Tulla X 239 kg ha-1 | 69.86gh | 332.47d | 39.49c | 33.39abc |
| Guntutei X 0 kg ha-1 | 72.24cd | 333.37d | 36.92cd | 22.078j |
| Guntutei X 100 kg ha-1 | 73.08bc | 340.11abc | 46.67b | 25.77ghi |
| Guntutei X 159 kg ha-1 | 74.83a | 343.48ab | 63.33a | 29.31def |
| Guntutei X 214 kg ha-1 | 70.82efg | 332.38de | 60.16a | 30.52cde |
| Guntutei X 239 kg ha-1 | 72.14cd | 334.11d | 63.44a | 28.19efg |
| Mean | 71.83 | 336.04 | 43.09 | 29.29 |
| CV | 1.08 | 0.75 | 7.86 | 5.83 |
| LSD | 1.32 | 4.29 | 5.74 | 2.89 |
Note:Means with the same letters in same columns are not significantly different N: Nitrogen, P :Phosphorus, S:Sulfur, B :Boron, %:Percentage, g:gram, MSRY: marketable storage root yield, CV:Coefficient of Variations, LSD: Least Significance Difference, SRDM: storage root dry matter , Kcal : kilo calorie .
Table 5 : Interaction effect of OFSP varieties and NPSB blended fertilizer on means utilizable carbohydrate, gross energy, marketable storage root yield, dry matter
Mean dry matter of storage root 35.4% was recorded as a significantly highest different by variety Tulla, which received 159 kg ha-1 NPSB fertilizer. This was not significantly different from Tulla with 239 kg ha-1 (33.39%), Kulfo with 159 kg ha-1 (33.48%), and 214 kg ha-1 (33.23%). The dry matter increased from 24.23 to 33.48% as NPSB fertilizer increased from 0 to 159 kg ha-1 with Kulfo variety, from 25 to 35% as NPSB fertilizer rate increased from 0 to159 kg ha-1 with Tulla and from 22.07 to 30.52% as NPSB fertilizer increased from 0 to 214 kg ha-1 with Guntutie. In line with this study, Dumbuya et al. reported that among 0,30,60,90 and 120 kg ha-1 P2 O5 treatments with Okumkom variety in Ghana, root dry matter content at 60 kg ha-1 P2 O5 (36.42%) was significantly higher than other treatments.
The conducted experiment was revealed that the main effects of varieties resulted in significant difference in proximate compositions. Accordingly, flower moisture content was a highly significant difference in variety Guntutei. Fat content was a highly significant difference in variety Kulfo and the least was scored by Tulla. Crude fiber content was a highly significant difference in variety Kulfo with the least was scored by variety Guntutei. Ash content was a highly significant difference in variety Kulfo and the least was scored by variety Tulla. Crude protein content was a highly significant difference in variety Tulla and the least was scored by variety guntutei. Utilizable carbohydrate content was a highly significant difference in variety Guntutei and the least was scored by variety Kulfo. There is no significant difference between gross energy content.
The fertilizer effect resulted in significant difference flower moisture content at 239 kg ha-1 rate; fat content at 100 kg ha-1; Crude fiber content at 239 kg ha-1 rate and zero rates; ash content at 239 kg ha-1; Utilizable carbohydrate at all except at zero and the highest rate and gross energy at the rate of 100 kg ha-1.
The interaction effects were resulted in highest significance difference in flour moisture content by variety Guntutie with 214 kg ha-1 (7.80%); fat content by variety Kulfo with 100 kg ha-1 (2.01%) and Guntutei with 159 kg ha-1 (2.04%); Crude fiber content by variety Kulfo without fertilizer (8.99%); ash content by variety Kulfo with 239 kg ha-1 (5.12%); Crude protein content by Tulla without fertilizer or control (12.64%); utilizable carbohydrate by variety Tulla with 100 kg ha-1 (74.99%) and Guntutei with 159 kg ha-1 (74.83%) NPSB fertilizer levels. Therefore, fertilizers containing S and B are important for the improvement of some qualities of orange- fleshed sweet potato-like fat, ash Protein, and utilizable carbohydrate. But it did not bring change in fiber even reduces the fiber content less than the value of controle. In conclusion, Kulfo variety was recommendable for its highest fat, fiber, and ash while Tulla for it protein content. They also had almost similar value in the interactions of NPSB fertilizer rates. As a result of these; proximate compositions of orange-fleshed sweet potato can provoke in parallel to yield.
The authors declare that they have no known competing financial interests or personal relationships that could have appeared to influence the work reported in this paper
Citation: Etana G, Belew D, Beyene TM. Proximate composition of orange fleshed sweet potato (Ipomoea batatas (L.) Lam) varieties as influenced by blended fertilizer level. AGBIR. 2022; 38(1):252-258.
Received: 07-Jan-2022, Manuscript No. AGBIR-22-41361; , Pre QC No. AGBIR-22-41361 (PQ); Editor assigned: 10-Jan-2022, Pre QC No. AGBIR-22-41361 (PQ); Reviewed: 24-Jan-2022, QC No. AGBIR-22-41361; Revised: 28-Jan-2022, Manuscript No. AGBIR -22-41361 (R); Published: 10-Feb-2022, DOI: 10.35248/0970-1907.22.37.252-258
Copyright: This open-access article is distributed under the terms of the Creative Commons Attribution Non-Commercial License (CC BY-NC) (http:// creativecommons.org/licenses/by-nc/4.0/), which permits reuse, distribution and reproduction of the article, provided that the original work is properly cited and the reuse is restricted to noncommercial purposes. For commercial reuse, contact reprints@pulsus.com This is an open access article distributed under the terms of the Creative Commons Attribution License, which permits unrestricted use, distribution, and reproduction in any medium, provided the original work is properly cited.