An International Journal
Agricultural and Biological Research
ISSN - 0970-1907
RNI # 24/103/2012-R1
RNI # 24/103/2012-R1
Research Article - (2024) Volume 40, Issue 1
Tuberculosis remains a global health threat, particularly in developing countries like Ethiopia, where Mycobacterium tuberculosis causes a significant impact, primarily affecting the lungs in the form of pulmonary tuberculosis disease. Sputum smear microscopy stands as the predominant diagnostic tool in such settings. This study aims to develop a K-Nearest Neighbor classifier model for the detection of pulmonary tuberculosis bacilli in microscopic sputum smear images. The study employed image processing techniques to identify pulmonary tuberculosis bacilli in digital images of stained sputum smears. K-Nearest Neighbor classifiers distinguish between two classes: Bacilli detection and non-bacilli detection. The image dataset, comprising 180 stained sputum images of pulmonary tuberculosis bacilli infections, was sourced from the Ethiopian Public Health Institute. The model's performance metrics, including accuracy, sensitivity, specificity and F-measure, demonstrate an impressive average accuracy of 92.6%. The developed model exhibits a sensitivity of 93%, specificity of 92% and an F-measure of 94.7%, highlighting its robust performance in pulmonary tuberculosis bacilli detection.
Pulmonary tuberculosis, Sputum smear microscopy; Machine learning; K-nearest neighbor; Model
Pulmonary Tuberculosis (PTB) bacillus, a highly contagious and infectious form of tuberculosis, primarily targets the lungs. Transmission occurs through the release of airborne droplets when individuals with active PTB cough, sneeze, or laugh (Heyd, 2020). Collaborative efforts between patients and healthcare professionals, including physicians, nurses, pharmacists and lab technicians, are crucial for its effective treatment [1]. While antibiotics offer a method of treatment, identifying PTB bacilli poses a significant challenge for medical professionals.
The prevalent global method for diagnosing active PTB bacilli disease is sputum smear microscopy, a technique that detects bacteria in sputum smear images [2]. Manual microscopic examination of Ziehl-Neelsen (ZN) stained sputum smears is the common approach, but it is time-consuming and prone to errors [3]. Lab technicians rely on this method, examining stained smear images under microscopy to identify viable or latent mycobacteria as red-coloured, rod-shaped objects.
In Ethiopia, the primary technique for diagnosing PTB bacilli is sputum smear image microscopy, specifically using Ziehl-Neelsen (ZN) or Acid-Fast Bacilli (AFB) stained. The whole process of diagnosis of Tuberculosis (TB) cases in Ethiopia, a laboratory test national standard, is depicted in Figure 1, which takes long time. However, AFB-stained processes are limited by manual diagnosis, inability to distinguish between viable and dead organisms, low sensitivity, high bacterial load requirements, and limited specificity. Sputum smear microscopy, though widely used, is time-consuming, tedious, subject to poor specificity and demands highly trained personnel [4].

Figure 1: Sputum smears microscopy examination protocol in Ethiopia (FEMOH, 2013).
Medical imaging, a crucial process for visualizing internal organs and tissues, has become indispensable in clinical analysis and intervention [5]. Advanced image processing and analysis techniques enhance the quality of medical imaging, providing quantitative data for patient care [6]. Recognizing the limitations of manual PTB bacilli detection, it is paramount to develop an automatic detection system using image processing techniques, addressing issues such as clinician workload, sensitivity, specificity and time consumption [4]. Such a system can assist physicians and pathologists, offering early PTB bacilli diagnosis, saving time, increasing accuracy and enhancing sensitivity. Hence, the study aims to develop a PTB bacilli detection model from sputum smear microscopy images using the K-Nearest Neighbor Classifier.
Different approaches and tools were employed to develop an automatic diagnosis system for PTB disease-causing bacilli. Experimental research design was employed to develop and test a prototype model using experimental methods. The dataset, comprising images of previously diagnosed PTB bacilli cases, was obtained from the Ethiopian Public Health Institute (EPHI). This image dataset was crucial for prototype system testing. EPHI was chosen for its expertise, experienced domain experts and the availability of the dataset.
The target populations included domain experts from the EPHI National TB Reference Laboratory staff. Purposive sampling was employed to select domain experts based on their professions, educational qualifications, and years of experience in PTB bacilli diagnosis. The total sample size for the image dataset was 180 (100 positives and 80 negatives) from stained sputum images of PTB bacilli-infected patients. Knowledge acquisition process involved interviews and document analysis. The architecture of the developed system based on PTB detection is depicted in Figure 2.

Figure 2: The architecture of the developed system.
Sputum smear images were collected from stained sputum smear specimens of PTB patients at EPHI. The Leica Microsystems microscopy, connected to a computer, facilitated image acquisition at 100x magnifications. The images were saved in Joint Photograph Experts Group (JPEG) file format, with 24 bits per pixel, in Red, Green and Blue (RGB) colour space. Both primary and secondary data sources were used, with primary data collected through interviews with domain experts and secondary data obtained from published articles, journals and TB program reports. Furthermore, Matrix Laboratory (MATLAB) software was used to implement the proposed prototype and the performance evaluation employed metrics such as accuracy rate, sensitivity, specificity and F-measure.
Design and implementation of automatic pulmonary tuberculosis bacilli detection system
The automatic detection and classification of objects into their respective diagnostic classes constitute a focal point in this study. The design and implementation phase involve the development of procedures tailored for an automatic PTB bacilli detection system, intending to aid pathologists in decision-making. This necessitates a comprehensive understanding of the entire process, encompassing image acquisition through digital image processing and domain expertise contributed by experts.
The subsequent task involves coding the image analysis and classification processes. For this study, MATLAB R2016a (9.0.0.341360) version of image processing tools framework was employed to construct the prototype, executable on a personal computer. The PTB bacilli detection process comprises distinct procedures categorized into predefined steps based on feature extraction.
Designing the system architecture of automatic pulmonary tuberculosis bacilli detection system
The Automatic Pulmonary Tuberculosis Bacilli Detection (APTBBD) system encapsulates the overarching framework for any vision algorithm dedicated to PTB bacilli identification in sputum smear microscopy images, aiding pathologists in decision-making. The developed system comprises five integral steps, namely image acquisition, image preprocessing, segmentation, feature extraction and classification.
In the initial step, digital images are acquired from a slide using Leica Microsystems microscopy connected to a Personal Computer. Subsequently, image preprocessing techniques are applied to remove noise and normalize the images for consistent colour characteristics. The third step involves image segmentation, a critical preprocessing step to extract informative features for human understanding and interpretation. Following segmentation, various discriminating techniques are applied to classify images, determining the presence or absence of PTB bacilli.
The architecture of the Automated Pulmonary Tuberculosis Bacilli Detection (APTBD) system, illustrated in Figure 2, delineates how the system operates during PTB bacilli detection. The process initiates with the acquisition of sputum smear microscopy images using Leica Microsystems microscopy. To mitigate noise introduced during image acquisition, image processing techniques such as filter algorithms and contrast enhancement are applied. Subsequently, features best suited to represent the image are extracted using image analysis techniques. Based on these extracted features, training and testing data are employed for identification purposes. This systematic approach ensures the efficient operation of the APTBD system, facilitating accurate and reliable PTB bacilli detection.
Image acquisition
A total of 180 stained smear images, comprising both negative and positive cases of Pulmonary Tuberculosis (PTB), were obtained from slides prepared with specimens from PTB patients. These specimens were collected using Ziehl-Neelsen (ZN) stained sputum smear microscopy, a conventional diagnostic technique employed at the National Tuberculosis Reference Laboratory of the Ethiopian Public Health Institute. The images were captured using Leica Microsystems microscopy, connected to a PC, as depicted in Figure 3. The pixel resolution was 696 × 514 and the images were stored in Joint Photograph Experts Group (JPEG) format, with 24 bits per pixel, in colour. Some ZN stained sputum smear images with poor resolution were excluded from the dataset. Each sputum smear image covered a 1024 × 756 μm field of view at the smear.
Image preprocessing

Figure 3: Sputum smear microscopy image from a sample of the specimen.
Following the image acquisition using Leica Microsystems microscopy, preprocessing became essential. Image preprocessing operates at the lowest level of abstraction, working with intensity images represented by a matrix of function values. The colour image segmentation began with the conversion of the original RGB image to the HSV colour space model. Given variations in colours resulting from different staining procedures for PTB detection, the HSV colour space was employed for colour image segmentation, facilitating the identification of sputum smear images (Figure 4). This conversion enhanced the image when the background of the enhanced image was off-white, aiding in the easy segmentation of bacilli images in the subsequent stage. Additionally, a Gaussian filter, a nonlinear digital filtering technique, was applied to remove noise information from the images while preserving edges.

Figure 4: Image converted from Red, Green and Blue (RGB) to hue, Saturation and Value (HSV).
This preprocessing step generated PTB images, either detected or not detected, with minimal noise compared to the original acquired images. The processed images then proceeded to the training phase's next step: Image segmentation. The primary goals of image preprocessing included image quality improvement, noise reduction, contrast enhancement, correction of missing or wrong pixel values, optimal data preparation for segmentation and elimination of acquisition-specific artifacts. Image preprocessing's effectiveness is closely tied to the quality of images acquired from Leica Microsystems microscopy connected to the PC. The overarching objective is to eliminate unwanted noise and enhance image features crucial for further analysis with specific techniques tailored to the nature of noise present in the image.
Image segmentation
After the image preprocessing stage, image segmentation is crucial for extracting high-quality features essential for image classification. Image segmentation serves the fundamental functions of clustering pixels with the same intensity values from entire image regions, separating regions or objects of interest and eliminating undesired regions or objects. It finds applications in various image preprocessing areas, including object recognition, handling object occlusion, boundary estimation, editing and querying from image datasets.
Algorithms for image segmentation typically rely on two essential properties of intensity values, i.e., discontinuity and similarity. Discontinuity-based algorithms partition image regions based on sharp intensity value changes, while similarity-based algorithms partition image regions that are alike according to specified criteria. In the context of sputum smear images, accurate segmentation is crucial for medical image analysis tasks, especially in computer-aided diagnosis. Various methods out there for segmenting sputum smear images of K-means clustering method is one.
K-mean clustering segmentation
Clustering serves as a method to group a set of data into specific clusters, and K-means clustering analysis involves assigning a set of regions into subsets (clusters) where observations in the same cluster share similarities. This method is employed for the classification of a given object into k number of classes, minimizing the squares of the distance between the object and the corresponding cluster. The K-means clustering algorithm involves the following steps:
• Select the center of K clusters, either randomly or based on some heuristic.
• Assign each pixel in the image to the cluster that minimizes the distance between the pixel and the cluster center.
• Recalculate the cluster centers by averaging all pixels in the cluster. Repeat steps 2 and 3 until convergence is attained.
Stained sputum smears, with their distinct characteristics of red bacilli against a blue and off-white background, present an exploitable property for segmentation of bacilli. Previous research indicated that K-means clustering is effective for segmentation of bacilli in stained sputum smear images. In this study, K-means clustering was employed for segmentation, resulting in RGB images with a black background and pink bacilli. The output was then converted to an image where undesired objects appeared black and the detected bacilli were displayed in white, facilitating the subsequent feature extraction process.
K-means clustering treats each object as having a location in space, aiming to find partitions where objects within each cluster are as close to each other as possible and as far from objects in other clusters as possible. The method requires specifying the number of clusters and a distance metric to quantify the proximity of objects. Using K-means to cluster objects into three clusters with the Euclidean distance metric, every pixel in the image was labelled according to the results from the K-means cluster. This pixel labelling allowed for the creation of segmented images based on colour, distinguishing objects on black backgrounds and bacilli images.
Image feature extraction
Image analysis involves extracting meaningful information to identify unique features of sputum smear images used for classification. Feature extraction in image analysis identifies the characteristics or attributes of a bacilli image, reducing the complexity in classification problems by measuring properties that distinguish one input pattern from another. For the analysis of PTB, two classification parameters were identified, namely, morphological (shape) features and colour features. Morphological features pertain to the geometric aspects of images, specifically the size and shape characteristics of PTB bacilli images. These features were extracted from binarization images, including area, eccentricity, compactness, perimeter, roundness, major length axis, minor length axis and EquivDiameter. The classification system was built upon morphology and colour analysis, considering an assessment of human visual inspection as the starting point. These features were crucial in identifying PTB bacilli based on their size and shape characteristics.
Area: Area is the number of pixels inside the region covered by a bacillus detected, including the boundary region. It is measured in square pixels. Where r is radius
A = πr² …………. (1)
Eccentricity (E): Eccentricity is the ratio of the distance between the foci of the ellipse and its major axis length. The value is between 0 and 1. An ellipse whose eccentricity is 0 is a circle, while an ellipse whose eccentricity is 1 is a line segment.
Where, a is major length axis and b is minor length axis
Perimeter (P): The length of the outside boundary of the region covered by the bacilli.
Compactness: It provides a measure of how closely the shape of the bacilli approaches a circle and it is the ration the perimeter and area of the bacilli.
Roundness (R): It measures the degree of roundness (circularity) of the shape of bacilli.
Where A is area a bacilli detected region in the image and P is the perimeter.
Major axis length (Major): It is the distance between the end points of the longest line that could be drawn through the PTB bacilli region. The major axis end points are found by computing the pixel distance between every combination of border pixels in the PTB bacilli boundary and finding the pair with the maximum length.
Minor axis length (Minor): It is the distance between the end points of the longest line that could be drawn through the PTB bacilli while maintaining perpendicularity with the major axis.
EquivDimeter: It is the diameter of a circle having the same area as the area a PTB bacilli region and computed as:
Where A is the area of a PTB bacilli region in the sputum smear image.
As a summary, the feature extraction likes area, compactness and eccentricity consist basic features which characterizes the objects properties of an image as states in. This can be used for the PTB bacilli classification of positive or negative of stained sputum smear images.
Colour features
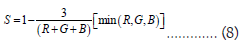
Colour is a distinctive feature of bacilli, showcasing variations in colour among different types of PTB bacilli. Colour analysis is computed by determining the mean values of Red, Green and Blue (RGB) components and Hue, Saturation and Value (HSV) components. The RGB colour space is extensively used and is typically the default colour space for storing and representing digital images. In the RGB colour space, computers, graphics cards and monitors utilize 24-bit images, where the red, green and blue components each have 8 bits [7].
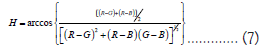
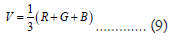
On the other hand, the HSV colour space offers a more intuitive representation of how people perceive colour compared to the RGB colour space. In HSV, hue distinguishes one colour from another, saturation describes the amount of whiteness in a light source within a given image and value measures the brightness of an image [7]. This perceptual description aligns more closely with human colour perception.
Normalized RGB is a representation easily obtained from RGB values through a straightforward normalization procedure. This normalization allows for a standardized representation of colour information, facilitating consistent analysis across images. The combination of RGB and HSV colour components provides a comprehensive perspective on the colour variations of PTB bacilli, aiding in the identification and classification of different bacillus types based on their unique colour characteristics.
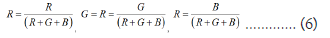
Therefore, to compute the mean values of each component in the RGB and HSV colour spaces, MATLAB 2016a was employed. MATLAB offers built-in functions for converting between RGB and HSV colour spaces, simplifying the process. The RGB image was split into red, green and blue components, and mean values of RGB and HSV were calculated for stained sputum smear images. The computed mean values included red, green, blue, hue, saturation and value colours from each component. In summary, a total of fourteen features (eight morphological and six colour features) were utilized for the classification of sputum smear images related to PTB bacilli detection.
Image classification
Image classification is the final stage in a pattern recognition system, involves assigning unknown patterns to specific categories. In the context of PTB bacilli detection, the patterns are the images themselves. The classification process entails categorizing objects in bacilli images based on measured values or features. These features are essential for identifying PTB bacilli patterns, classifying them into positive or negative categories. The image classification model comprises three main components: (i) Representation of image features, (ii) learning and (iii) testing for semantic categories and classifiers that make decisions about the identified patterns, such as PTB bacilli in sputum smear images.
Feature representation
Features, or attributes, are values measured from stained sputum smear images, including morphological and colour features. A total of fourteen features (eight morphological and six colour features) were employed for identifying PTB bacilli in sputum smear images, classifying them as either PTB bacilli detected or non-PTB bacilli detected. The two major classes selected for this study were positive (assigned a value of 1) and negative (assigned a value of -1). These classes represented PTB bacilli detected and non-detected, respectively. The dataset comprised 180 sputum smear images and a supervised learning method was used for training the classifier. The training process involved 70% of the dataset, while the remaining 30% was used for testing the classification accuracy.
Training and testing phase process
The training and testing phases involved randomly selecting datasets using the crossvalind function, which creates random partitions. The classifier was trained with 70% of the dataset, emphasizing the importance of high-quality training samples for accurate classification. Training labels were specified to correspond to the order of training nodes. After training the model, its performance was evaluated using the remaining 30% of the dataset, measuring accuracy, sensitivity, specificity and F1 score. These performance metrics provided a comprehensive assessment of the classifier's effectiveness in PTB bacilli detection. Accuracy indicated the ratio of correctly classified observations to the total observations, sensitivity measured the true positive rate, specificity gauged the false positive rate and the F1 score represented a weighted average of sensitivity and specificity. These metrics collectively determined the accuracy and reliability of the developed model for PTB bacilli detection in sputum smear images.
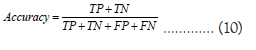
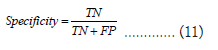
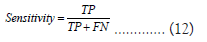
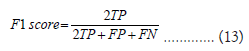
Where, TP: True Positive; TN: True Negative; FP: False Positive; FN: False Negative.
Support vector machine classifier
For superior classification performance in PTB bacilli detection, accuracy, sensitivity, specificity and F1 score were chosen as key metrics. The Support Vector Machine (SVM), a supervised machine learning algorithm versatile in both classification and regression tasks, was selected for its potential to deliver higher accuracy compared to other classifiers. SVM excels in finding an optimal hyperplane in higher-dimensional feature space, effectively separating distinct categories within input data. Additionally, SVM is known for its efficient training capabilities, even with a large volume of input data. The algorithm plots each data point as a point in an n-dimensional space, where n represents the number of features, with the goal of finding a hyperplane that effectively differentiates between the two classes, PTB bacilli and non-PTB bacilli detected.
Classifying results
The initial phase involved using images to establish a knowledge base (image database) for classification. Sputum smear images, subjected to image preprocessing techniques and K-means clustering for segmentation, constituted the training dataset. Fourteen features, comprising morphological and colour features, were extracted from each image to create a robust knowledge base. Subsequently, SVM classification trained on the fourteen input features and two output vectors representing positive and negative classes was applied to identify PTB bacilli in the testing phase.
Implementation of automatic pulmonary tuberculosis bacilli detection
This section details the implementation of the PTB bacilli detection process, encompassing five key image processing steps: Image acquisition, preprocessing, segmentation, feature extraction and classification. The first step, image acquisition involves capturing images from stained sputum smear slides, obtained from the National Tuberculosis Reference Laboratory at the Ethiopian Public Health Institute (EPHI). The second step employs image preprocessing techniques to enhance image quality by eliminating unwanted noise. Consideration is given to various environmental factors, such as lighting and camera resolution, to optimize the visual appearance of images. This critical preprocessing step minimizes noise and enhances image quality after acquisition. Image segmentation, the third step, is a pivotal stage in image analysis. Segmentation methods divide images into homogeneous and meaningful regions, with pixels in each region sharing identical properties. The segmented images yield binary results, from which morphological and colour features are extracted. These features play a crucial role in identifying PTB bacilli and assigning positive or negative classifications. In general, the process involves capturing images, refining them through preprocessing, segmenting them to extract relevant features and employing SVM classification to identify PTB bacilli. The developed system demonstrates a comprehensive approach to automatic detection of PTB bacilli, leveraging advanced image processing techniques and machine learning algorithms for accurate and efficient diagnosis.
Development environment
The development of the PTB bacilli detection system, integrating advanced image analysis techniques, requires a substantial investment. From image acquisition, necessitating a high-quality digital camera and a controlled environment, to resource-intensive image preprocessing techniques, the system demands powerful computing resources. The developed system was implemented and tested on a PC with an Intel® Core™ i5-4200U CPU, operating at 2.30 GHz speed, 4.00 GB of RAM, and a 64-bit Microsoft Windows 10 operating system.
Binary image analysis
Binary image analysis involves transforming an image’s pixel values into 0 s and 1 s, essentially black and white. In this study, white was inverted to black, indicating the object of interest or the mass region, while black was inverted to white, representing other parts of the bacilli image. MATLAB R2016a, a multi-paradigm numerical computing programming language environment developed by MathWorks (www.mathworks.com, 2018), was used for binary image analysis. MATLAB proves to be a robust tool for image analysis and processing. It can read, load, edit, delete, process and analyse various image formats. In the presented study, MATLAB read and loaded a sequence of images stored in a folder one by one. It enhanced the quality of each image, removed noise and converted the image into a binary format for subsequent feature extraction purposes. The MATLAB code utilized the readimage (filename) function, with the image file name depending on the format of the file in the data store. The readimage function supports image formats compatible with imread. The sample image loaded into the MATLAB is presented in Figure 5.

Figure 5: Sample of input sputum smear image.
Image segmentation
Image segmentation plays a crucial role in isolating stained sputum smear images from the background and in this study, K-means clustering techniques were employed for this purpose. The process initiated with the utilization of the built-in imread function to capture the input sputum smear image. The choice of the HSV (Hue, Saturation, Value) colour space is based on its closer correspondence to human colour perception compared to the RGB colour space. The conversion to HSV was facilitated by the rgb2hsv function.
HSV colour space proves valuable in generating high-quality images in computer graphics, especially in selecting distinct colours relevant to identifying bacilli images. Its significance lies in its ability to represent the desired colour (bacilli object) effectively. The HSV colour space is particularly pertinent to identifying bacilli images, aligning with human perception in PTB bacilli detection. When performing histogram equalization of a colour image for PTB bacilli detection based on intensity components, HSV is advantageous due to its robustness to slight changes in lighting conditions and its capability to eliminate undesired objects. The subsequent steps involved calculating and plotting the histogram for each HSV colour component. The average HSV values across all image pixels were then computed and plotted, as depicted in Figure 6. Among the HSV colour components, the value of the image colour emerged as particularly effective in distinguishing PTB bacilli from other undesired objects.

Figure 6: Converted Red, Green and Blue (RGB) to hue, Saturation and Value (HSV) colour space with histogram value.
After applying HSV color, V (value) image was selected to better understand components used to represent a color for identifying PTB bacilli detected based intensity components to separate objects. Then, the next step was applying the Gaussian filter to remove noises in sputum smear image based value image color. In addition, contrast enhancement was used to improve the quality of sputum smear images which is more important for user interpretation. It is differentiating in visual a property that makes bacilli objects distinguished from other objects and backgrounds. To convert Gaussian filter algorithms: G=Imgaussfilt function and to convert contrast enhanced, C=Imadjust function was used in MATLAB as shown in Figure 7.

Figure 7: Value colour image, gaussian filter and contrast enhanced.
Figure 8A shows that the K-mean clustering algorithms is used to generate the cluster 1, 2, 3 and 4 based on the potential value of the image. The number of centers is generated based on number of the cluster K. This center is used as the initial center in K-means algorithm. Using the k-means algorithm, the image is segmented into K number of cluster. After segmentation of the image, it can still contain some unwanted region or noise. Although k-means has the greatest advantages of being easy to implement, it has some drawbacks. The quality of the final clustering results depends on the arbitrary selection of initial centroid. Thus, if initial centroid is randomly chosen from cluster 1- 4, it will get different result for different center. The initial center will be carefully chosen so that we get our desire segmentation of bacilli objects as shown in Figure 8B. Then, was needed to consider while designed the K-means clustering. Then, the detected bacilli Region of Interest (ROI) for using boundary region line width color methods on the image or the region of each pixel that we are interested in computing for morphological and color feature was selected.

Figure 8: A) K-means cluster used segmented image; B) segmented image after k-means results; C) region boundary with line colour segmented.
Morphological features analysis
A morphological feature is the size and shape characteristics of sputum smear images of PTB. Eight (8) morphological features were identified. They were area, eccentricity, compactness, perimeter, roundness, major length axis, minor length axis and EquivDimeter of the PTB bacilli detection. These features were computed from the image binary analysis. Figure 9A shows a region of interest of PTB bacilli images that were interested in computing its morphological features based region of interest by boundary with edge colour.

Figure 9: A) Morphological feature computed based on label region of interest; B) morphological feature computed based on boundary region line label region of interest with colour.
Based on the detected region of interest as shown in Figure 9B, morphological features were computed on each sputum smear image by using region properties image analysis methods in MATLAB. The results of these eight morphological features computed the MATLAB function presented in Figure 10. These features were computer from the binary image analysis from sputum smear image region of interest and the measured values are in pixels. As shown Figure 10, the mean value of each feature computed by used formula, from each sputum smear image for a better performance.

Figure 10: Morphological feature value of each label region of interest.
Color feature analysis
Color features are visual attributes of sputum smear images that results from the light emitted or transmitted or reflected and six color features were identified. They were computing the mean value of Red, Green and Blue (RGB) color components and the mean value of Hue, Saturation and Value (HSV) color components. Therefore, to compute the mean value of each component of these color spaces we used to split each component to separate image values. To do these, MATLAB coded functions were used as shown in Figure 9A. After each colour component was splited, the mean values of each component colours were computed by RGB function methods based on the specified region of interest of identified PTB bacilli as shown in Figure 11.

Figure 11: Value of colour feature in each label region of interest.
In summary, from Figures 10 and 11, the label of region of interest, which computed the value of each label region of interest of the morphological feature and computed mean value of each component of (HSV and RGB) colour was again computed by using MATLAB tools function. The computed mean values of combined results from the fourteen features were as shown in Figure 12.

Figure 12: Computed combined both mean value of morphological features and mean value of colour features.
The results of mean value of the fourteen features (eight morphological features and six split of color component of features) as shown in the table contain hue, saturation, value, red, green, blue, area, eccentricity, perimeter, compactness, roundness, equivdimeter, major length axis and minor length axis. These features were used for better classification to keep the results to identify the PTB detected or not detected. Column normalization was done on the obtained extracted features to identify the PTB bacilli. In addition, the radiologist (lab technician) reading of each sputum smear microscopic image label as PTB positive is (1) and as PTB negative is (-1) was shows in Figure 13, to each feature as input to differentiate the two classes of the sputum smear images. Hence, the total input features were fourteen and region of interest label for each sputum smear image. These features were used to classify the PTB positive or PTB negative detected.

Figure 13: Labelling of Pulmonary Tuberculosis (PTB) bacilli detected positive and negative assigned by pathologists.
Experiment results
Experimental results ensure the realization of the developed system. It is an integral part of the development of PTB bacilli detection system. The experiment was carried out by using image processing techniques PTB bacilli by implementing algorithms in MATLAB platform.
First the input image was resized by using MATLAB function imresize with 300 × 400 pixel rates. The Figure 14A shows the resized the original images query. The HSV colour space converted was applied for essential to segment sputum smear images, the process of choosing the suitable colour space for better automatic detection of PTB bacilli affect with the staining of smear image and the procedure that was used for acquisition the bacilli image as shown Figure 14B. In this preprocessing phase the Gaussian filter was used for reduced noised from bacilli image as shown in Figure 14C and contrast enhanced the bacilli image was enhanced by with adjustment as shown in Figure 14D. In segmentation phase was done by implementing K-means clustering algorithm with the K value of 3. The Figure 14E demonstrated the segmented region of interest. After the segmentation process, the segmented image was converted to black and white image to facilitate the extraction of features. The Figure 14F demonstrated the conversion of RGB bacilli image into binary bacilli image and then fourteen features were extracted from the resultant image. The dataset is grouped into two classes PTB bacilli positive or PTB negative.

Figure 14: Experimental results of all process of developed methods; A) input bacilli image (original image) and resized image; B) converted bacilli image from Red, Green and Blue (RGB) to hue, Saturation and Value (HSV) colour space; C) applied bacilli image using Gaussian filter; D) applied contrast enhanced; E) illustrate the bacilli image after K-means segmentation bacilli object in cluster 3 choose; F) classify Pulmonary Tuberculosis (PTB) bacilli results after implementing the represent the feature extraction.
The computation of morphological and color features was described in details. In total, fourteen features (eight morphological and six color features) were identified. These features were used to classify different sputum smear images of PTB bacilli detected. In this study, it was designed that the experimental scenarios test the classification performance by taking the extracted features of sputum smear images. The classification was tested by using SVM classifiers algorithms to get a more accurate result. To do so, the train classifiers, i.e., a set of training sputum smear images was required, and the classes label where it belongs to. For this purpose, 180 sputum smear images were taken from EPHI from the predefined two types of PTB bacilli includes positive and negative sputum smear images Figure 15.

Figure 15: The classification result of SVM classifier scenario of PTB bacilli positive and negative; 
 .
.
There were two basic phases of pattern classification, namely training and testing phases. The researchers used SVM classifier which is used a well-known algorithm to identify PTB in a given class, based on training data. The basic ideas are that the classifier takes a set of training content representing known example of class and by performing statistical analysis of the training content, using the knowledge from the training content to decide to which classes other unknown content belongs. In this study, a classifier was used to gain knowledge base (database) content based on the statistical analysis performed during training. Hence, to design the classifier partitioning the total dataset into training and testing dataset was necessary. From the total dataset of each sputum smear image type, 70% was used for training and to build classification model, and the remaining 30% of the total was used for testing purpose. From the total of 180 datasets, 126 were used for training and 54 were used for testing. In general, a classifier has some input features based on the scenario of the designed experiment and some output features [8].
Support vector machine classifier result
Support Vector Machines (SVMs) are foundational binary classification algorithms renowned for their extensive generalization properties and computational efficiency. The algorithm is particularly favored for classification tasks owing to its capability to establish decision boundaries through the concept of decision planes. Decision planes serve as boundaries that distinguish between objects belonging to different class memberships. In the context of this study, the objects were categorized as either green or red.
The decision plane functions as a separator, delineating a boundary where objects to the right side are classified as green, and those to the left side are classified as red. Any new object, represented as a white circle, falling to the right of the separating line would be labelled and classified as green, while falling to the left would result in a classification as red. In this study, the SVM classifier played a pivotal role in classifying PTB bacilli detection.
Experimental scenarios were designed based on the features extracted. For each scenario, the SVM classifier algorithm was applied to the selected views of sputum smear images within the dataset. As previously mentioned, 70% of this dataset was allocated for training, and the remaining 30% was reserved for testing purposes in each scenario. This approach ensured the robust training and evaluation of the SVM classifier in the context of PTB bacilli detection [9].
Analysis of the findings
The experiments were conducted under different scenarios by using extracted features of the sputum smear images. The experimental results of SVM classifier using 30% percentage splitter were shown over the scenario and their performance summarized in Table 1.
| Actual/predicted class | P | N | Total |
|---|---|---|---|
| T | 36 | 15 | 51 |
| F | 1 | 2 | 3 |
| Total | 37 | 17 | 54 |
Table 1: Scenario for diagnostic result of testing data using Support Vector Machine (SVM) classifier.
The dataset for this study comprised a total of 180 sputum smear images. The dataset was divided into two classes, distinguishing between PTB bacilli-positive and PTB bacilli-negative sputum smear images. The classification of test images into PTB bacilli-negative or -positive was conducted by domain experts (pathologists) from EPHI, who assessed and labelled each image.
The SVM classifier was employed with both morphological and colour features, encompassing a total of fourteen features (eight morphological and six colour features). The testing dataset consisted of 54 sputum smear images, and the classification performance of the proposed system was evaluated based on the results obtained from the SVM classifier and the ground truth.
Pathologists often face challenges in identifying PTB bacilli, with an error rate exceeding 50% due to oversights or manual processing errors. The developed system, however, demonstrated a higher level of accuracy, influenced by the skills and decision-making abilities of pathologists.
The system's performance was tested using a sample dataset derived from the ground truth, and the results were measured using accuracy, sensitivity, and specificity. The confusion matrix, a standard tool for evaluating classification models, was utilized for this purpose. The SVM classifier made a total of 54 predictions, with 36 images predicted as positive and 15 as negative. However, the actual readings by pathologists indicated 51 positive and 3 negative images.
The evaluation metrics, including accuracy, sensitivity, specificity and F1 score, were calculated based on the confusion matrix. The results, presented below, provide a comprehensive assessment of the PTB bacilli detection system's performance. These metrics serve as crucial indicators to gauge the effectiveness of the system in accurately identifying PTB bacilli in sputum smear images.
From the performance results, the overall detection accuracy was 94.4%, while sensitivity was 95%, specificity was 94% and F1 score was 96%. As per the researchers’ knowledge, there is no local research attempts made to use sputum smear image by using image processing techniques for detection of PTB bacilli, but there are different researches that used image processing techniques for identify PTB bacilli positive or negative elsewhere. By considering the above performance results of automatic PTB detection system from sputum smear images using image processing techniques, it is important to compare with previous studies done by Osama (2016) the same area [10]. Osama (2016) used image processing approach which is applied to tuberculosis bacilli identification in sputum smear image conducted by tuberculosis reference Laboratory (TRL) at national laboratory of public health in Khartoum, Sudan. The main objective of the study was to enhance, segment and classify the sputum smear images for computerized process of tuberculosis identification. The results obtained lead to conclusion that the system can forecast with considerable sensitivity (83.07%) the decision of PTB bacilli identification based on HU moments and morphological features used, a finding which is in line with our studies outcome. The detail comparison of our findings with that of Osama is presented in Table 2.
| Author | Microscopy | Preprocessing techniques | Segmentation techniques | Feature extraction techniques | Classifier | Performance measurements and results in (%) | |||
|---|---|---|---|---|---|---|---|---|---|
| Accuracy | Sensitivity | specificity | F1 score | ||||||
| This study | Leica Microsystems microscopy (DM LS2) connected to PC | Convert RGB to HSV ( used V image value), Gaussian filter and contrast enhanced | k-mean clustering +boundary region line with color | 8 morphological features and six color features | Support Vector Machine (SVM) | 94.40% | 95% | 94% | 96% |
| Rao Osama, 2016 | ZEISS iLED microscope and NIKON D3100 |
De-correlation and Stretching Gaussian filter Contrast stretching |
L*A*B color space +K-mean clustering | 4 morphological features and hu moments from 1 to 7 feature | Support Vector Machine (SVM) | 81% | 83.07% | 66.66% | Not specified |
Table 2: Comparison of the developed system with the previous studies.
Upon comparing the findings with Rao Osama's study conducted in 2016, it is evident that Osama achieved a lower sensitivity of 83.07%, compared to the current study, which is 95%. This discrepancy may be attributed to the increased incorporation of morphological features and colour features in the present work, providing a more comprehensive representation of the real working environment.
The current research introduces a combined set of eight morphological features and six colour features, resulting in an impressive F1 score of 96%. Notably, the former study did not specify F1 score performance measurements. Additionally, Osama's work utilized two morphological features, namely eccentricity and compactness, contributing to its accuracy of 83.07%. However, it is important to note that focusing on only two morphological features may not fully represent the diversity of features considered in the current study [11].
The current research addresses this gap by comprehensively analyzing the existing situation, incorporating a broader spectrum of features. The combination of eight morphological and six colour features exhibits greater discriminating power than the previous study [10]. The synergistic effect of combining both morphology and colour features enhances the system's ability to discriminate between different classes. Moreover, the performance metrics of the support vector machine classifier in the current work, including accuracy (94.4%), sensitivity (95%), specificity (94%) and F1 score (96%), showcase significant improvements compared to the values reported in previous study. This highlights the advancement and enhanced performance of the prototype developed in the current research.
The development of an automated Pulmonary Tuberculosis (PTB) detection system, utilizing low-cost image processing techniques, holds immense potential for aiding in the diagnosis of PTB in resource-constrained regions. This study presents a novel algorithm for the automatic identification of PTB bacilli in stained sputum smear images, providing a valuable contribution to PTB diagnosis. The system leverages conventional microscopy, allowing for the utilization of low-cost equipment prevalent in developing countries. The dataset, sourced from the Ethiopian Public Health Institute (EPHI), forms the basis for algorithm training and evaluation. By accurately detecting and classifying PTB bacilli, the system aims to enhance the efficiency of PTB diagnosis, particularly in areas with limited access to high-quality diagnostic resources.
The algorithm employs image processing techniques, including Gaussian filtering and contrast enhancement, to preprocess and improve the quality of acquired images. K-means clustering facilitates image segmentation, extracting essential features for PTB bacilli identification. Fourteen features, comprising eight morphological and six colour features, are employed for the classification of PTB bacilli in sputum smear images. The study employs a Support Vector Machine (SVM) classifier, leveraging both morphological and colour features for PTB detection. The developed Graphical User Interface (GUI) serves as a user-friendly platform for image input and results display, indicating whether PTB bacilli are detected or not.
In terms of performance evaluation, standard image processing metrics, including accuracy, sensitivity, specificity and F1 score, are utilized. The proposed system demonstrates commendable results, with accuracy, sensitivity, specificity and F1 score measuring at 94.4%, 95%, 94% and 96%, respectively. The promising outcomes indicate the system's potential as an effective tool to aid pathologists in the early-stage diagnosis of PTB bacilli.
The authors acknowledge Jimma University for providing a small research fund and EPHI and the domain experts for taking part in this study.
Citation: Abdeta D, Diriba C, Jimma W. Pulmonary tuberculosis bacilli detection in sputum smear microscopy images using image processing techniques. AGBIR.2024;40(1):887-898.
Received: 26-Dec-2023, Manuscript No. AGBIR-23-123888; , Pre QC No. AGBIR-23-123888 (PQ); Editor assigned: 28-Dec-2023, Pre QC No. AGBIR-23-123888 (PQ); Reviewed: 11-Jan-2024, QC No. AGBIR-23-123888; Revised: 18-Jan-2024, Manuscript No. AGBIR-23-123888 (R); Published: 25-Jan-2024, DOI: 10.35248/0970-1907.24.40.887-898
Copyright: This open-access article is distributed under the terms of the Creative Commons Attribution Non-Commercial License (CC BY-NC) (http:// creativecommons.org/licenses/by-nc/4.0/), which permits reuse, distribution and reproduction of the article, provided that the original work is properly cited and the reuse is restricted to noncommercial purposes. For commercial reuse, contact reprints@pulsus.com This is an open access article distributed under the terms of the Creative Commons Attribution License, which permits unrestricted use, distribution, and reproduction in any medium, provided the original work is properly cited.