Agricultural and Biological Research
RNI # 24/103/2012-R1
Research Article - (2024) Volume 40, Issue 3
Scientometric analysis and topic modeling deployed in this survey in order to map and structure knowledge in the state of art of farm financing decision making. Application of scientometric approach based on bibliometric analysis help to capture the interest of scholars and organization to the problem domain and also found essential in clustering keywords, authors and publication to some sort of schemes and hence mapping of knowledge through visualizing map. Topic modeling as complement of bibliometric analysis further extends and makes clear how those keywords semantically related and their contribution to topics while clustering based on bibliometric analysis is binary. Using both methods and approach refed as TAKe, publications from different source and type examined and analyzed for state of art of farm financial decision making. The survey then signals, in the state of the art of farm financial problem, financing has been treated for descriptive or exploratory purpose than as decision variable hence predictive consultancy than prescriptive advisory in farm financing investment.
Farm; Decision; Scientometric; Topic modeling; Cluster; Mapping
With modelling as practice of capturing real phenomenon via, most of the time, abstraction, a yet important issue is system classification, modeling objective and approach or purpose (normative vs. positive). Modelling objective might include either of (i) Descriptive, (ii) Explanatory (iii) Predictive or (iv) Decision model while the last two of this classification however in the contemporary research interest are highly emphasized due to the potential they provide in answering policy question in the problem domain say for instance in agriculture economics and financial problems. Since, surely to say that, every farm decision is constrained and most of farmers especially in developing country potentially exposed to various risks including production, financial and marketing risk, proposing specific model or framework is impossible and that is the case that makes farm investment decision challenging. Furthermore, from Financial Management (FM) perspective, decision generally varied in both impact and frequency to the economy. The JRCâ??s scientific and technical report on investment behavior in conventional and emerging farming systems under different policy scenarios considers the importance of reviewing literature to capture insights over (i) Determinants (ii) Effect of policy and (iii) Classification of quantitative tool for analyzing farm investment decision. Literature in farm investment therefore has shown a progress in two versions:
• In line with general economic literatures during 1950’s and 1960’s.
• Specific to agricultural economics literature explored during 1990’s.
Literatures, mainly starting 1980’s, have focused on number of investment related topics and finding from the report essentially reveals the gap related to various issues. These includes:
• Instruments to deploy.
• Model adaptation towards farmer preference and expectation.
• Closer attention to the connection between investment, technical change and learning.
• A more empirically relevant treatment of the decision maker’s (farm household’s, or farms) objectives.
Moreover, failure in policy analysis and treating it separately even in the recent studies is a major area need intervention. Epistemological and ontological approach has been recommended in farming system to work as both interdisciplinary approach and multidisciplinary integration in order to incorporating the hard and soft version of the problem domain like Farm Financing Decision Model (FFDM). Practically, these all, however, are addressed separately instead of deploying principles and methods not only from various discipline but also from approaches at and from different perspectives. Note that, though drowning in information, academia is still starving for knowledge and implies that we are wanted to organize such bulk information and transform it to knowledge. This is essentially demanding as today’s decision making environment is influenced by such dramatically accelerated and bulk of data from Science, Technology, and Innovation (STI) activities. One way of bringing to front the selection over methods, tools, and approaches in one hand, and not to overlapping and repetition on the other hand, is evidence identification through systemic review and meta-analysis. Moreover, reviewing literature also help to capture development trends of discipline and how such temporal change has altered the entire topic. Concerning to topical change and intellectual structure in Library Information Science (LIS), Han (6) classified literature review methods as:
• Continent analysis.
• Bibliometric method and
• model based approach.
Highlighting the first as the task of scheme classification of research content to detect research development and was focused around 1970’s-1980’s is sufficient here and readers are referred for detail to and references therein. Since, in one hand, bibliometric methods are prevalent approaches in evaluation studies through its techniques see keywords analysis, citation analysis, co-occurrence and bibliographic coupling. On the other hand, model based approaches are recent methods towards capturing intellectual structure of a scientific domain and overhands the remaining two in term of examining larger corpus, we give attention here. Consequently, bibliometric analysis, which has been brought to the age of big data for mapping such evidence identification, is the central scheme of this paper for the problem domain under investigation. Objective in this survey therefore is to assemble a comprehensive library of literatures on the pattern of decision making over farm financial decision problem in order to study the progress of the problem domain over time. Since the area under investigated is polycentric and is composed from wide array of disciplines and subject area among others, finance, business, economics, accounting, agriculture, assessment of literatures at perspective of domain analysis that most of the time has been demonstrated separately is motivational for topic modeling. A two stage approach then followed at which the first stage of the survey is an initial bibliometric analysis based on bibliographic metadata and demonstrated using open access analysis software VoSviwer. Using the result of the bibliometric analysis, in the second stage, a Topic Modeling (TM) approach from contemporary Machine Learning (ML) paradigm and fundamental of Natural Language Processing (NLP) considered to identify topics to such interlinked disciplines that are believed to show a correlation in the decision making process of a farmer and/or financial institutions for instance. Ultimately, deployment of TM is for discovering thematic structure from the corpus of documents (publication) to the problem domain. Keywords and abstract from retrieved publication respectively considered as vocabulary and corpus of document while publication extracted from Zotero reference manager used for comparison purpose since it was extracted purposely specific to the problem being studied. Remaining sections therefore extended with setup of methods and materials in section 2, and result and analysis in section 3 to state of art of the interest while section 4 discussions and interpretation of the result obtained. Finally conclusion, and take notes presented in section 5 [1].
Since the purpose of this scientometric and topic modeling is both to map and structure knowledge obtained from publication, survey design and description of tool and technique are prime tasks.
Survey framework
Figure 1 presents the two stage analysis approach that first demonstrates a bibliometric analysis and followed by topic modeling based on the findings especially on the three important components of a publication, title, abstract and key words abbreviated as TAKe. Our bibliometric analysis in the first stage therefore starts with selecting search engine through both generic and extended query terms supported by Boolean operator “OR”. Setting inclusion and exclusion criterion are also part of this step while the analysis step mainly focused on those two-bibliometric analyses: Citation analysis and co- occurrence analysis by highlighting to those remaining bibliographic analysis techniques. The second stage on the other hand begins with some preprocessing task to make ready data for topic modeling [2].
Search Engine Selection (SES)
In their investigation over Google scholar, Microsoft Academic, Scopus, Dimensions, Web of science, and Open citations‟ COCI for a multidisciplinary comparison of coverage via citation, ranked such six data source recently. The rank in descending order of citation percentage to 2,515 English language published documents with 3,073,351 citation: Google scholar (88%), Microsoft academic (60%) which share, however, with Scopus and Web of Science (WoS) respectively as 82% and 86%. Scopus then place in the third rank while the fourth one is dimensions (54%) than that of WoS. Dimensions still take the share of 84% with Scopus and 88% with WoS citation. Furthermore, it found more citation than Scopus in 36 categories, more than WoS in 185. According to their investigation, limitation regarding to dimensions for that analysis period was its failure to cover humanity fields. It could be realistic to generalize that its editorial policy for Google Scholar to share higher percentage not only for this finding but also in general cases, i.e. Google scholar follows an inclusive and automated approach [3].
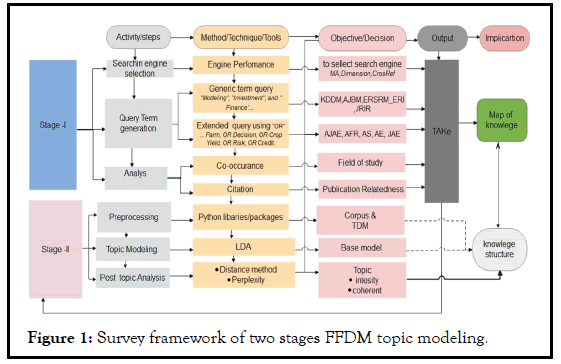
Figure 1: Survey framework of two stages FFDM topic modeling.
Though, Microsoft Academic Search (MAS) ended in 2012, a new platform called Microsoft Academic (MA) launched in 2016 whereas new scholarly search database, dimensions, launched by digital science with a fermium model i.e. only advanced functionality like API (Application Programing Interface), which designed to facilitate bulk access in MA. According to dimensions have tried to include grants, patents and clinical trials besides of books, book chapters and conference proceedings in the publication index. As a newly approach towards data source, significance of dimension has been compared to other data source as has done by and reference therein. Comparison made as discussed so far while investigation only between dimensions and Scopus at country and institutional level. We rather are ignorant for this research interest, comparing databases at perspective of country and institution, while comparison based on coverage, still dimensions guarantees a 25% greater than Scopus. According to and reference therein, WoS covers about 75 (155) million records in its core collection (regional and subject specific) citation index, Scopus over 76 million records and Google scholar over 300 million records. In general, as depicted in the approach, Google Scholar Search (GSS), Microsoft Academic (MA), Crossref, and dimension searching engines selected for this investigation [4].
Query term generation and publication retrieving
A two step analysis methodology followed at which the first is based on using generic term modeling, investment, and finance to capture the state of the general problem dimension while in the second analysis a further investigation demonstrated using additional query terms using the “OR” Boolean operator. This is since both the publication and source retrieved using such generic term does not warranty for drawing a conclusion specific to the case of FFDM, additional query terms Boolean operator “OR” as farm, OR decision, OR crop yield, included. For both co-authorship and citation analysis an inclusion and exclusion criterion followed to imply that an author and organization should have two documents with minimum of a single citation not to narrow down role of both organizations‟ and authors‟ in the problem interest and indeed this is further justified by imposing minimum citation for document to be unit. In all the retrieving process, a further restriction imposed is to retrieve publications from primary source and all the publication must have a DOI. Since maximum number of literature that Vosviewe, an open accessed tool for publication retrieval, can analyze is 5000, a separate analysis made for the source using MA and Crossref in VoSviewer by selecting journals based on their performance rank obtained from both dimensions analysis using VoSviewer and PoP. Moreover, VoSviewer also allow us to analyze our trial quest through the reference manager (Zotero) as a data source. Table 1 therefore presents data type and data source used in this investigation [5-9].
| Category | Items | Search engine/database | |||
|---|---|---|---|---|---|
| Microsoft Academics (MA) | Crossref | Dimensions | Google (Scholar) Search (GSS) | ||
| Data type | Bibliographic | ✓ | ✓ | ✓ | ✓ |
| Network data | ✓ | ✓ | |||
| Text data | ✓ | ✓ | |||
| Data source | API download | ✓ | ✓ | ||
| Database file | ✓ | ||||
| Zotero reference manger | ✓ | ✓ | |||
TABLE 1: Data type and data source followed
According to Purnwokibn Sangadi, bibliometric analysis as quantitative tool of assessing the academic publication, does not measure science, scientist, or scientific productivity rather help to map science, which is both complex and cumbersome. According to cluster publication, determining publication relatedness is the first task either based on citation relation or word relation. Citation relation generalizes Direct Citation (DC), Bibliographic Coupling (BC), and CO-Citation (COC) whereas word relation is about word sharing based on either title and/or abstract and/or full text. Since, BC shows relatedness between publications, that cites the same publication; and citation relation is about publication cited by the same publication, DC better detects research fronts than COC and BC. Whereas for DC is rather less accurate and these two generalizations by themselves are true if long and short period (less than five year) respectively imposed as inclusion and exclusion criterion. According to COC and BC requires two DC and hence indirect methods they are. Since aim of this survey is to explore the extent and depth of research history, approach and mechanism regarding agriculture and finance particularly crop production as subsystem of farming that is polycentric inherently where both multidisciplinary and interdisciplinary are attractive, analysis method based on co-occurrence and co-citation more preferred, which, however, doesn’t mean others are not touched. For both co-authorship and citation analysis an inclusion and exclusion criterion followed to imply that an author and organization should have two documents with minimum of a single citation not to narrow down role of both organizations and authors in the problem interest and indeed this is further justified by imposing minimum citation for document to be unity. In all the retrieving process, a further restriction imposed is to retrieve publications from primary source and all the publication must have a DOI [10].
Preprocessing
As classical text mining method, topic modeling helps to represent documents (publication) as space vector to compute and analyze similarity among vector and documents respectively. Left side of Figure 2 gives topic modeling structure for LDA (Latent Dirichlet allocation) at which a three layer Bayesian probability model composed of N-words, k-topic (prior), and M-text or document. Purpose in LDA is to train for the output of ψ (the distribution of words for each topic K) and φ, the distribution of topics for each document i using the two most Dirichlet prior concentration parameters that represents (i) Document topic density (α-parameter) and (ii) Topic word density (β parameter). With a higher α (β), documents (topics) are assumed to be made up of more topics (words) and result in more specific topic (word) distribution per document (topic) [11].
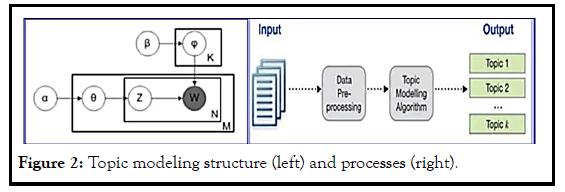
Figure 2: Topic modeling structure (left) and processes (right).
Moreover, due to evolution of issues and concepts dynamic topic modeling is also available while in this survey we restricted ourselves topic modeling with LDA and Ber topic, a topic modeling technique that uses transformers (BERT embedding) and class based TF-IDF to create dense clusters and it also allows to easily interpret and visualize the topics generated. Three stages in BerTopic include (i) Embedding the textual data (documents), (ii) Cluster documents and (iii) Create a topic representation. Implementation of BerTopic in this analysis is based on “paraphrase-MiniLM-L6-v2 sentence transformers since the semantic similarity is for single, i.e., English language publication only. In its best, BerTtopic uses the more preprocessing step called UMAP (uniform manifold approximation and projection) than LDA and scikit learn and even is better to the competitive one in the state of art t-SNE2 to boost the performance of density based clustering. By leveraging transformers and, c-TF-IDF, BerTopic helps to create dense clusters allowing for easily interpretable topics whilst keeping important words in the topic descriptions. The modeling followed here is using genism, Scikit respectively from, Natural Language Processing (NLP) and machine learning, and BerTopic. In any of the packages, the priori task is data preparation and preprocessing to obtain dictionary and corpus respectively to map word to unique id and bag of words thus both dictionary and bag of words (corpus) used as input for topic modeling [12].
Dictionary and corpus preparation
Using Title, Abstract and Keywords (TAKe) dictionary and corpus prepared for topic modeling. Those obtained 894 keyword from AJAE then forms 894 × 791 spares matrix with 1620 stored elements and transformed to their root using word lemmatizer function and reduced to 894 × 760 with 1591 stored element. This small reduction was due to the sufficiently sparsity (0.998) of the original corpus and about 1591 unique vocabulary present in our word list (corpus). As indicated in the word cloud, economic, market, risk takes the higher weightage and followed by decision, model, management and capital. On the other hand, topic modeling based on the analysis of title and (abstract) of publication from reference manager (Zotero), done using Scikit learn, genism and BerTopic. Using tiff Vectorizer, CountVectorizer from sclera feature extraction text, topic modeling based on Scikit package deployed with test size of 0.2. Each document first converted to list of words using countvectorizer and transformed into 351 × 1001 ( 241 × 4865) sparse matrix with 3320 (22986) stored elements in compressed sparse row format to title and (abstract) respectively. Once again sparse matrix and obtained as 0.99 (0.98). The vectored documents now converted to bag of words (corpus) using doc2bow and a total of 194 (1555) unique words after removing infrequent and common words unique words in initial 351 (241) documents with unique word 881 (4196). This is done by filtering out words that occur less than 3 documents, or more than 60% of the documents. Hence, pruning the common and rare words, we end up with only about 22.02 % (37.06%) of the words [13].
Three important source of publication deployed, MA, Crossref and reference manager in depth besides the dimensions that simply helps to extract keywords in particular.
Microsoft Academics (MA)
Tables 2 and 3 presents result of bibliometric analysis for selected sources while the graphical illustration portrayed in Figure 3 displays the general bibliometric analysis result of FFDM. Since, a two stage query term regeneration approach followed, first using generic terms and followed by terms with Boolean operator, the priori gives no sound results to the problem questioned. Explicitly, using query term of modeling, investment, and finance only 185 publication retrieved on Microsoft Academic (MA) and of those 854 keyword for analysis method of co-occurrence with field of study as unit of analysis 129 meets the threshold, hence for the combination of (occurrence, TLS), economics as a keyword obtained to take the top occurrence (85,403) and followed by business (50,253), investment (41,226) finance (38,191), and econometrics (30,149). For the Boolean operator implementation, a cross validation approach followed since VoSviewer software potentially gives a maximum of 5000 publication only, those sources in table 4 like Journal of the American Association statistics (JAA); Journal of Financial Economics (JFE); Econometrica (Econ.rica); Machine Learning (ML) also found essential from the PoP analysis [14].
| Source | Documents | Citations | TLS |
|---|---|---|---|
| American Journal of Agricultural Economics (AJAE) | 70 | 1478 | 115 |
| Agricultural Finance Review (AFR) | 86 | 856 | 83 |
| Agricultural Systems (AS) | 71 | 2349 | 67 |
| Agricultural Economics (AE) | 35 | 666 | 53 |
| Journal of Agricultural Economic (JAE) | 9 |
Note: TLS: Total Link Strength
Table 2: Analysis of top four journals correlated with problem studied using dimensions database (total analysis)
| Source | Documents | Link | TLS | Av.norm.citation |
|---|---|---|---|---|
| AJAE | 70 | 4 | 50 | 0.79 |
| AFR | 86 | 4 | 33 | 0.4 |
| AS | 71 | 4 | 23 | 1.35 |
| AE | 35 | 4 | 21 | 0.65 |
| JAE | 9 | 4 | 21 | 0.87 |
Table 3: Analysis of top four journals correlated with problem studied analysis (between selected sources)
Moreover, as described in the methodology section, those results of Tables 2 and 3 and Figure 3 are results from databases and a total of 6858 publications retrieved at which AJAE takes the higher share (22.2%) and followed by as (19.4%). consequently, based on the relevance to the problem domain, five journal as source of publication identified using the TLS, link and citation and a total of 271 publication with 894 keywords at minimum threshold of three, left. Figure 4 then display location distribution of AJAE and conveys that how agricultural research and publication has enhance in the developed country, particularly American universities has put their enormous contribution to the sector [15].
Crossref
The result of so far discussed were based on the search engine of Microsoft Academic (MA) based on API that is somewhat less restrictive and an alternative exploration made for search engines called crossref. A crossref based publication retrieving done for further exploration of the bibliometric analysis in the problem domain. Since separate exploration, using crossref in VoSviewer only possible for single term expected to appear only on the title of publication need to be retrieved. Since another inclusion and exclusion criterion is also required for impossibility of retrieving due to inherent restriction on maximum publication of VoSviewer, again search is restrict on the source that is identified earlier as better AJAE. Figure 5 then presents the bibliometric analysis result of crossref database for terms indexed and one important advantage of crossref based exploration is the possibility to examine at single term which however is a limitation on the other hand.
Reference manager
In this case that publication intentionally collected and stored in Zotero reference manager utilized. Figure 6 demonstrates that most of the publication are recent and of those 351 retrieved publication 228 are articles (64.96%) and followed by book section (article in series) (10.83%) whereas book, conference paper and thesis (dissertation) takes third, fourth and fifth position. Reports, webpage and blog posts are part of source though supplied little publications. Bibliographic analysis particularly to coauthorship to this source is as depicted in Figure 7 at which a total of 733 authors contributed and the horizontal axis implies author publication relationship and arithmetically almost three authors are expected in each of the publication, whereas, as depicted in of those 733 about 50 authors have at least two and at most five publications. The remaining 668 authors, however, does not mean that each has a single publication as they would appear as co-authored of and referenced author. Since documents with more than one authors that accounts about 33.14% (117/353) the knowledge comes from similar source of knowledge and of course similar research scheme indeed. One important mechanism to classify to which of the research scheme of those publications can be categorized is to clustering in VoSviewer those 733 authors of those 733 authors, only 14 authors are connected as indicated by the non-gray colors and displayed in networks depicted in Figure 8 and classified in to three clusters using documents as weight factors and average of publication year as score value of the visualization. Cluster one (Yellow range in Figure 8) therefore ranges averagely from 2013 to 2014 and above and composed from 7 items (authors). Cluster two (green range) on the other hand ranges from 2008 to 2013 and composed from 4 items including Lempert and Robert while cluster three (blue range) ranges between 2004 and 2008 averagely. The maximum Total Link Strength (TLS) using full counting method obtained for Lempert and Robert, authors with number of documents equal to four, attains TLS of 16 and using binary counting the maximum TLS is 5.00 by Brige, Johon R and Foveaux Francois, authors with five document while Lempert and Robert receives a TLS of 1.0 [16].
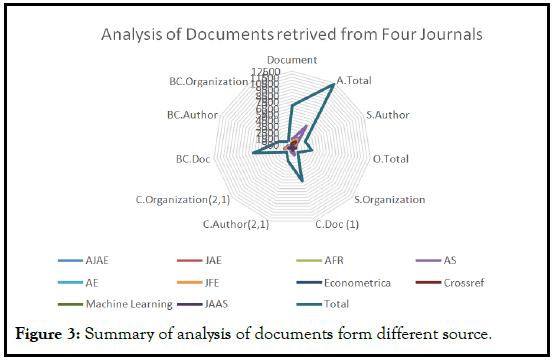
Figure 3: Summary of analysis of documents form different source.
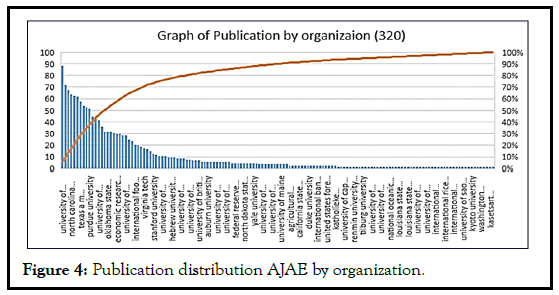
Figure 4: Publication distribution AJAE by organization.
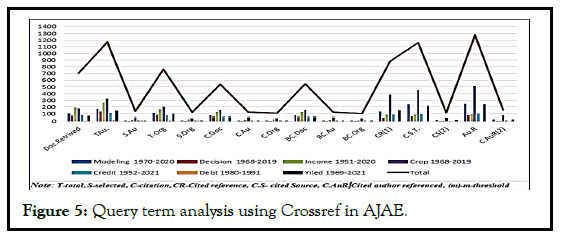
Figure 5: Query term analysis using Crossref in AJAE.
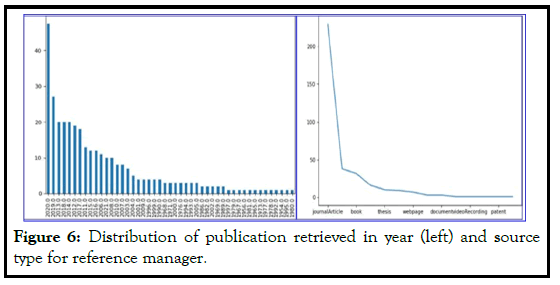
Figure 6: Distribution of publication retrieved in year (left) and source type for reference manager.
This is shows how full and binary counting methods can be distinguished that can be only observed on the network link Strength at which the importance of fractional (binary) counting method to reduce the influence of documents with many author. The reference manger (Zotero) result shows that the number of publication for abstract reduced by 104 since abstract for those publications like webpage, report and even some book section are not made available. Then summarize the result finding and both knowledge mapping and knowledge structuring now likely to drawn from the analysis followed and interpretation and discussion then make clear each of the result in the subsequent section [17].
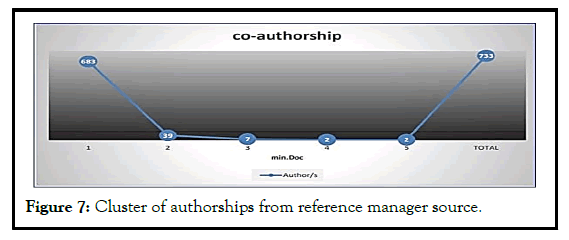
Figure 7: Cluster of authorships from reference manager source.
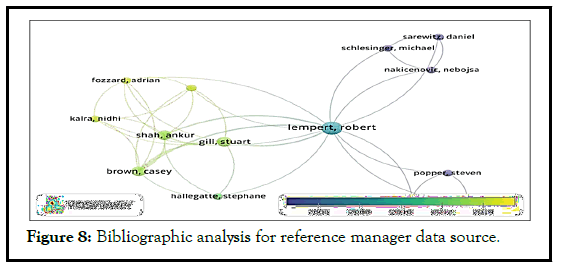
Figure 8: Bibliographic analysis for reference manager data source.
Analysis
According to cluster publication determining publication relatedness is the first task either based on citation relation or word relation while major aim of the survey to acquire and structuring knowledge over various approaches and methodologies of farm financing decision making. Analysis of publication mainly did using citation and co-occurrence as both of these analysis helps to learn about a filed or topics. Alternatively, since aim of this survey is to explore the extent and depth of research history, approach and mechanism regarding agriculture and finance particularly crop production as subsystem of farming that is polycentric inherently where both multidisciplinary and interdisciplinary are attractive, analysis method based on co-occurrence and co-citation more preferred. Since this, however doesn’t mean others are not touched, co-authorship (authors vs. organization) for example discussed based on a (2) threshold inclusion and exclusion criterion followed to imply that an author and organization should have two documents with minimum of a single citation not to narrow down role of both organizations and authors in the problem interest a (as made available in Figure 3) though did not appear here due to space limitation [18].
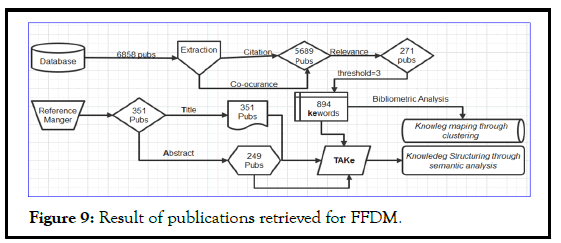
Figure 9: Result of publications retrieved for FFDM.
Citation analysis
With threshold of unity as minimum citation for publication, of those retrieved 185 publication using generic query term, 113 documents identified and the maximum citation (407) achieved by Marks Glaser. In fact, this figure is the second maximum citation as the top citation was scored by Dean T. Jamison but, since it doesn’t create any link (link=0) to any others, it becomes seventh. Hence, what matters, however, are link and only six publications: Marks Glaser Jing yuan Wan, Lin Wiliam Cong, Milan Lovric, Huewin Lin and Tirades Bashir found to make it. The work of Dean T Jamison entitled as global health 2035: a world covering within a generation, “overconfidence and trading volume” is also the title of the document by Markus Glaser. These two paper, however, seems to have no direct implication to our problem interest FFDM and it is due to the generic query term used. On the other hand, if unit of analysis instead selected to be source of the literatures, from 138 total sources about 91 sources obtained, if minimum threshold for document of source and citation of source set to unit. Otherwise, list of source reduced to 9 if the threshold number of document increased to 2 or 3. With link as weight, only three sources found visible including Knowledge Discovery and Data Mining (KDDM), African Journal of Buses Management (AJBM) and Erim Report Series Research in Management Erasmus Research Institute (ERSRM_ERI). Extending the analysis by score perspective that is normalized by citation, knowledge discovery, and data mining source still rated as almost to 4.0 which is an impact factor for the journal actually according to VoSviewer manual generalization [19].
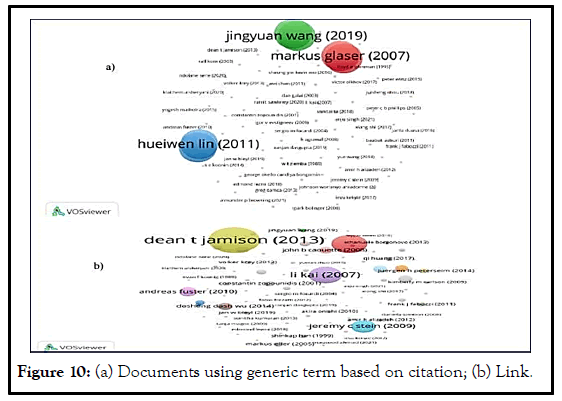
Figure 10: (a) Documents using generic term based on citation; (b) Link.
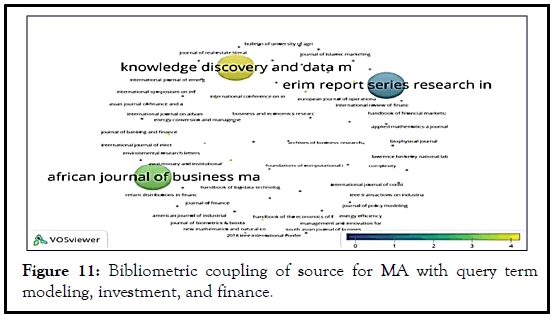
Figure 11: Bibliometric coupling of source for MA with query term modeling, investment, and finance.
As method of extrapolating the subject matter of two works, bibliographic coupling analysis is essential which is closely related to co-citation but actually are about retrospective and forward looking perspective respectively. The bibliometric coupling analysis with source as analysis unit and minimum number of document for the source and minimum number of source citation respectively set to one and two to give 75 sources from 138 sources. Strength of bibliometric coupling to such 75 source with other source calculated at which cabernets with two document, five citation, and total link strength of 114 takes the top position and followed by ERSRM_ERI, Jeneva Risk and Insurance Review (JRIR) and AJBM. The overly visualization of source with link as a metric of weights and average normalization of citation as a score value to indicate impact factor of journals (sources) as indicated by the color (blue, green and yellow) respectively for low, medium and high impact of the source. Journal of economic perspective at cluster seven for instance creates 17 (though clusters are not made available) links and has total link length 37 with average normalization that is based on the association method is 4.96 (Yellow range) while Journal of finance has a link of 10 and total link strength 15 with scale value 7.77 and again in yellow range (high impact). It can be continued to the entire source and two more important sources we wanted to mention here again are KDDM and AJBM that are both in the range of yellow and green with scale value 4.27 and 3.02 respectively. Since both the publication and source retrieved using such generic term does not grantee for drawing a conclusion, and it is why additional query terms then added with Boolean operator “OR” as farm, OR decision, OR crop yield, OR risk, OR credit for more specific analysis to the case of FFDM [20].
On the other hand, for crossref database, using citation as a weight and normalized citation as score value, example of publication, those that are highly cited in their range: low (0.0-0.75), medium (0.76-1.5) and high (1.51>) identified as listed in Table 4. Using search term “income” that was not used in the previous analysis, 192 publications retrieved with minimum number of citation for a publication rather specified as five and 125 publications pass the threshold. Again these publications ranged from 1970 to 2010 and maximum average normalized citation as scale value obtained to be five (yellow range). These 125 publication, however, reduced to 70 due to disconnection between publications, and fall to 69 cluster, almost a publication as a cluster, hence exemplifying publication made here for those with in the yellow range only 4.5> of and some of these publication are from sno-29-38.To demonstrate a comprehensive search using such terms in Crossref database, a publish or perish software used since it help to search publications other than specified. For example, with source specified AJAE on the space provided, the result gives other source including, agricultural economics, European review of agricultural economics. One limitation of this technology is that it generates only 1000 publication and a total of 19032 citations with 271.89 and 19.03 citations per year and paper respectively. It reports author per publication as 2.11 with h and g index of 66.9 and 105 while the hi-norm obtained to be 47 [21].
Co-occurrence
Using AJAE with minimum number of occurrence of a keyword at three, 894 keywords from 3077 analyzed to give economics with 946 occurrence and 6422 TLS take the top position and followed by business and agriculture. This result analysis in fact is seems indifferent with the analysis made using title only. It is also evidential that the schema of FFDM yet dominated by the field of economics, business, econometrics, microeconomics, and agricultural economics.
Moreover, as can be seen, financial economics, future contract, and finance it shown to have high correlation too. Capturing something essential to the schema of FFDM from this particular source of information is possible through the analysis of how those clusters classified. Cluster one with red ball (circle) representation in AJAE of and this cluster consists of 152 items that are mainly for modeling and solving methods, as it includes (none, linear, goal, dynamic and stochastic) programing, mathematical optimization etc. The second cluster, (green ball) with those 122 it emphasized to market and economic analysis including the financial analysis while third cluster, blue ball (with 98 items) is especially to economic, environmental and ecosystem challenges of agricultural business. Similar to cluster three, cluster four, yellow ball, also seems to deal about agricultural business, which however, emphasized on the economic growth particularly to food safety and subsidies and still highly dependent on the market economy and agribusiness. Moreover, agricultural, commercial, and financial policy, especially concerned to globalization and issues of hazard makes these and other clusters cluster linked. This can be justified further, if we take agricultural economics in cluster seven (orange colors) that also includes agronomy and agricultural science and agricultural engineering, is highly interlinked to other clusters as essential research interest of agricultural research. Cluster 5 with purple ball circle mainly are about resource managements, where those methods and approaches from both economics and econometric are demanding. It mainly composed with those types of issues focusing to economic model, economic evaluation and economic efficiencies including issues related to environment starting from essentiality of planning to policy matters including risk issues while cluster 6 (those with aqua ball) is more or less to deal about a process how decision making is constructed and its constructs. It clearly constructed with terms that shows the importance of the As-IS approaches and business decision mapping along with data collection and methods of decision analysis including conceptual framework and decision support system. Issues related to theories and principles in the problem domain asserted in cluster 8 (Brown balls) including principle of information asymmetry, mainstream economics, managerial economics and positive economics as well as theory of firm. Economics as highest cited field of study in cluster 10 of the pink colors is more of about economic theories while subject of both macro and micro economic to deal both investment production decision are highly versatile to study. For instance production function, which is in cluster 8 for instance an essential one for microeconomics? Due to those theories and principles like production function and theory of firm, this cluster highly correlated to those most clusters. Those terms like production model, production risk, and simulation modeling in cluster 9 for instance is highly correlated to many of other clusters including cluster 1, 10, and 12. Cluster, those with light green 11 is more about risk and risk mitigation mechanism especially related to financial risks in the field of actuarial science, a discipline that assess financial risk in the insurance and finance filed using mathematical and statistical methods. Figure 10 provides snapshot of the query terms from each of the cluster formed by VoSviewer analysis to capture the linkage among those 13 clusters. For instance for the term “modelling” three clusters found to consist it with 18 items. On the other hand, using another important term “decision” about 17 terms identified only from cluster 1 and cluster 2. This term, however, highly emphasized in cluster 2 as of those 17 it consists 16 items. Extending the filtering to the one that is emphasized in this investigation, “finance” only two clusters found with five items cluster one with one item and cluster two with four items. Instead of the general term, Finance, an indicative term in this aspect instead is “credit” and about nine items phrased in this case which, however, again obtained in two clusters one and five. As observed in this filtering and from the general fact of the problem domain under investigation, an essential items that is central also to those research interest is “risk” which in this case it is to mean total risk found to take high shares in terms of items and clusters i.e., about thirty two items from five clusters. This conveys that about 3.6% of those keywords in one or another ways dealt about risk and its extension and create linkages of about 38.5% of clusters. Similarly, co-occurrence analysis from the source Agricultural System (AS) provides 668 keywords from those 2452 that are classified into ten clusters with: environmental (429, 3464), agriculture (442, 3462), agronomy (327, 2936) and yield (251, 2004) takes the first four position(occurrence, citation), as indicated by blue (C3); green (C2); C3; and yellow (C4) for each of cluster i of AS in those red balls (circles) in this source denote C1 and include production, mathematics, and computer science to convey how to model agricultural economics and manage knowledge. It is visible among others knowledge management for instance strongly connected with relatively thick curved line, with agriculture and business in C2, to indicate high linkage among and between keywords in the network [22].
Generally, those items in C1 (red ball) are more about methods and tools of capturing agricultural problem while C2 (green ball) deals about the subject matter and related theories in agriculture C3 on the other hand composed of items that emphasize the science of agriculture, technologies as input while nature of agricultural outputs, and related activities, like for instance sawing, concentrated on C4 and have a strong linkage with C8 that deals about mechanisms for high input activities like cropping irrigation. Using JAE 187 keywords classified into eleven clusters, which is more similar to AJAE. Periodically those key terms concentrated ranging 1990 to 2010 with minimum of average minimum and maximum (0, 60) or (0.6, 1.4) average normalized citation. Agricultural Economic (AE) based on proposed setup pro vides 1172 keywords of which 281 keywords meets the minimum requirement from those 400 publications by 863 authors from 272 organization. That 181 selected keyword then classified into nine clusters at which economics takes the top in terms of occurrence of 293, with links of 270 and TLS of 1812. Predictably followed by agricultural economics with occurrence of 143 and TLS 926 and keywords like agriculture, production and yield takes next position with (occurrence, TLS) respectively (128, 843) (85, 584) and (55, 330). A similar analysis for both coauthor ship and cooccurrence for Agricultural Financial Review (AFR) that give a retrieval of 347 publication by 625 authors from 102 organizations performed and 232 keyword from those 917 clustered into ten clusters. The co-occurrence analysis still provides economics (volute ball in AFR) appear first with (occurrence, Link, TLS) of (215, 219, and 1399) and agriculture (green ball) (111, 175, 730) and business (aqua ball) (114, 195, 748) for instance found in the first row of the analysis. These three keywords, in fact, are from different clusters as indicated by the color of each circle (ball) in at which read balls is cluster one, green ball cluster two while volute and aqua color indicates cluster five and six respectively [23].
A similar analysis for Crossref database is possible but it is very cumbersome as the analysis is term by term. Using key term “modeling” as query term for example provides about 97 publications under the inclusion and exclusion criterion in term of publication ranging from 1950 until now. The retrieved publication reported, however, ranges from 1970 to 2020 while the co-aligned term “decision” retrieved ranged from 1968 to 2019 with 72 publications. It is evident that issues regarding to decision modeling in farming activities were emphasized after the late 1967 whereas discussion and research related to income and related financial issues like credit backs to 1950’s and are hot research interest still. Yes, it is true that yield is more related to modeling and is possibly affected by farmers decision hence crop modeling as demonstrated is an important concern in farm decision. For Crossref co-occurrence, portrays network of 328 keywords at which only those non-grayed are connected that are 60 and categorized in 8 clusters. computer science machine learning, statistics machine learning and mathematics optimization and control takes the first three top position in terms of occurrence and TLS with full (fraction) counting method respectively, 8, 8 and 7, and 15, 16 and 11 (8, 8, 6). Almost about 90.8% of the keywords obtained to occur at a rate of unity but with different TLS value if full continuing method followed unlike that of fractional counting method that gives an equal value of TLS with occurrence [24].
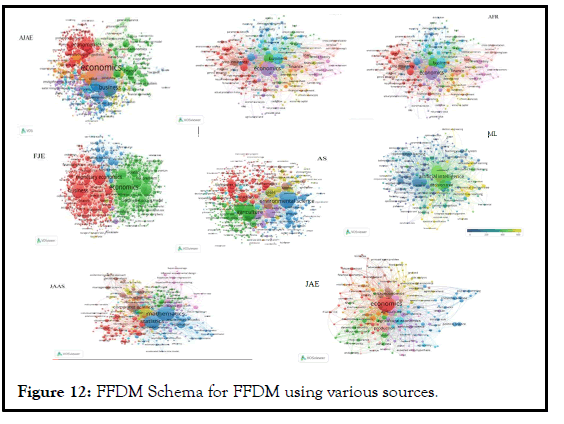
Figure 12: FFDM Schema for FFDM using various sources.
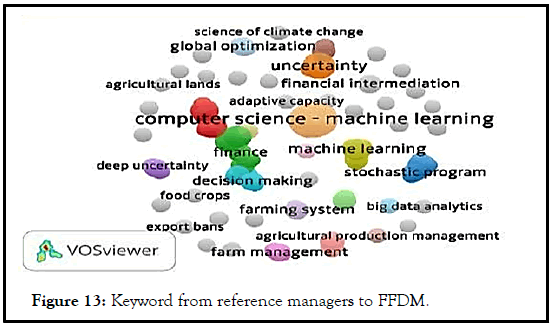
Figure 13: Keyword from reference managers to FFDM.
Report from full counting methods to those low occurrences (unit), especially related to topics that are highly coherent to problem domain of the study as illustrated bellow rather implies they are co-occurred and signifies that how publications are inter related in the network of the knowledge domain specified (Table 4). Consequently and as is demonstrated in the below list of some terms, though are in frequent each of the keywords instead are not ignorant at full counting method, since the maximum TLS in this case from key word simulation” is 19 and is not much far away to each of the examples given below next to Figure 14.
| Components | Variables | |
|---|---|---|
| Adaptive policymaking | 1 | 5 |
| Agent-based modeling | 1 | 5 |
| Agile analytics | 1 | 6 |
| Agricultural advice | 1 | 8 |
| Agricultural credit | 1 | 2 |
| Agricultural entrepreneurship | 1 | 8 |
| Agricultural finance | 1 | 8 |
| Agricultural production management | 1 | 5 |
| Agricultural production planning | 1 | 3 |
| Agricultural productivity | 1 | 3 |
| Agriculture | 1 | 3 |
| Agriculture and state | 1 | 3 |
| Ecological model | 1 | 4 |
TABLE 4: Components and there variables
Moreover, as captured from the overly visualization of Figure 14, that is constructed from those 60 items and clustered to 8 clusters the using total link and publication year (average) as weight and score of visualization scale some kind of pattern can be visualized and understood in the evolution of the knowledge which furthers will be elaborated in topic modeling. Since each of the clusters scored based on average year of publication years, those publications indicated by blue color almost are about modeling of decision makings particularly the normative approach, using methods and techniques from mathematics and statistics (econometrics, stochastic programing). While (light green) on the average around 2005 as indicated by the most occurred keyword, simulation, is a positive approach towards farm decision related to finance. Since normative and positive approach in farm decision showed developments in methods and tools to each of the approaches and includes development of algorithms and introduction of data analytics. This development and evolution of tools and techniques in solving both normative and positive approaches now days, however, converge to the era of data driven approach as indicated by the yellow circles of Figure 14 and is hot research recent topic today. One advantage of VoSviewer in bibliometric analysis is it is flexibility related with number of clusters to be constructed through its resolution button of the analysis tab that sets default value for resolution to unity. The higher the value of resolution at positive integer, the more the number of cluster formed to show shallowed and specificity and vice versa. Not only for better and for ease presentation, rather for precise generalization that would be reevaluated in the coming section of topic modeling, those 8 clusters reduced to 6 by setting resolution to 0.5. In doing so, merging of keywords from those reaming two clusters reassigned to such six new clusters and the original structure now agitated, say for instance keyword“ decision making” in cluster one of the new grouping was in cluster three. Using text data format from those 5338 terms obtained from those 353 publications, 659 terms only pass minimum occurrence threshold of three and using the relevance score default value of VoSviewer (0.6) 359 terms exposed for analysis. Despite of its less occurrence, term Continuous Time Financial Models (CTFM), takes the top with respect relevance value of 3.11 while the least relevant term obtained in this analysis is „supply‟ with relevance of 0.34. The highest occurred term as observed in the right most of is the term “Ethiopia‟ with occurrence of 41 and relevance value of 0.477. Since minimum occurrence is 3.0 with average occurrence of terms equal to 6.2, the occurrence value of term “Ethiopia‟ signify many things that we would try to list some of them later, compared to that of less occurred but relatively high relevant term Continuous Time Financial Model (CTFM).
These 395 terms then now classified into six clusters as depicted by various colors of network visualization in while statistics of clusters as summarized in table 4 and portrayed in sing most top terms in terms of occurrence and relevance for each of the clusters table 5 tries to illustrate to which research schema of the clusters are most persuaded. Terms those are general and common like book, end, section, task, in cluster for instance ignored for consideration. One important term that might not have any semantic information is term “scoff” in cluster one that instead is an author who contributes a lot to the theory of system modeling than reductionist approaches. Therefore, though it does not help to extract semantic information, its repeated occurrence in the cluster along with other terms like theory and prescriptive analytics signifies something that is important for the central scheme of the cluster. With respect to occurrence of term or keyword like prescriptive analytics and theory in cluster one respectively implies the importance of bridging prediction and optimization approach and how to follow approaches and methods in the farm decision making. On the other hand, as relevancy of term used for evaluation, CTFM and learned policy in cluster one again suggests how dynamic is the financial modeling and it is essential to having flexible environment of financial policy respectively. With similar fashion to reaming terms and clusters and using implication from each of terms in the cluster, drawing the generalized implication is given for each of the clusters as listed in Table 5 [25].
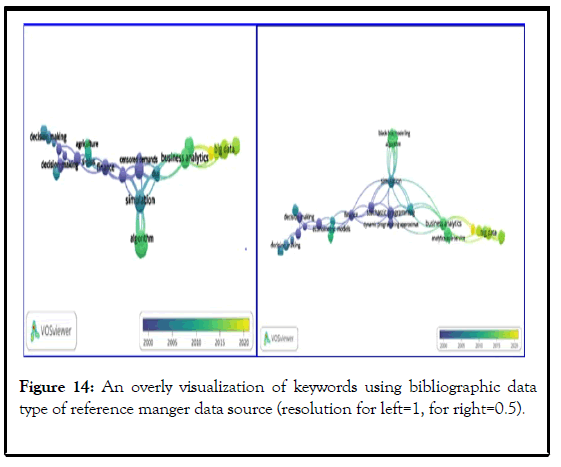
Figure 14: An overly visualization of keywords using bibliographic data type of reference manger data source (resolution for left=1, for right=0.5).
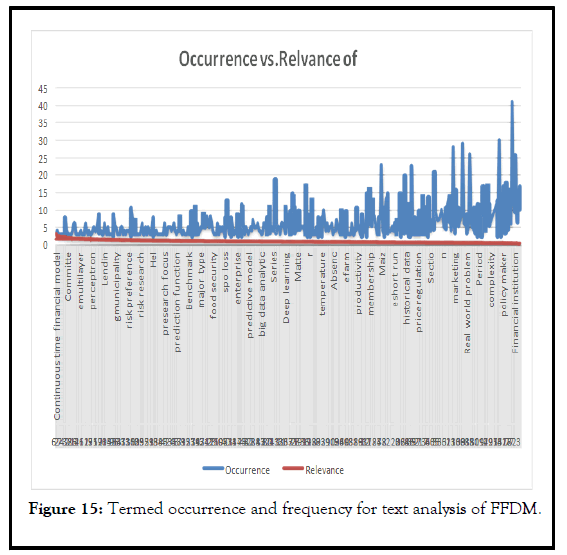
Figure 15: Termed occurrence and frequency for text analysis of FFDM.
| #Items | Max.Ocu | Min.Ocu | Max.rel | Min.rel | Ave.ocu | Av.rel | % | |
|---|---|---|---|---|---|---|---|---|
| C1 | 143 | 30 | 3 | 3.114 | 0.451 | 6.373 | 0.967 | 36.20% |
| C2 | 133 | 41 | 3 | 3 | 0.339 | 6.409 | 0.92 | 33.67% |
| C3 | 48 | 30 | 3 | 2.373 | 0.55 | 5.511 | 1.156 | 12.15% |
| C4 | 28 | 25 | 3 | 2.268 | 0.464 | 5.857 | 1.116 | 7.09% |
| C5 | 26 | 20 | 3 | 1.749 | 0.564 | 6.923 | 1.023 | 6.58% |
| C6 | 17 | 12 | 3 | 2.258 | 0.644 | 5.176 | 1.241 | 4.30% |
| 395 | 158 | 18 | 14.762 | 3.0108 | 36.24966 | 6.42317 |
Note: Max (Min).Ocu: Maximum (Minimum) occurrence; Max (Min).rel: Maximum (Minimum) relationship; ave (ocu).rel: average (occurrence) relationship.
Table 5: Statistic of clusters
•C1: Modeling approach and procedures, starting from descriptive
modeling to the most recent prescriptive approach.
• C2: Farm modeling and implication of financial leveraging.
• C3: Farm decision using recent approach in the domain of Artificial
Intelligence (AI).
• C4: Theory of financing and its attributes in the theory of firm.
• C5: The need of exploratory modeling in policy analysis.
• C6: The spatial evidence how farming activity is crucial to
communities‟ livelihood.
Topic modeling
This section is not for comparative analysis of bibliometric analysis made so far instead to complement and strengthen it. This is because of that topic modeling is more efficient than that of bibliometric, at which (co) word mapping is don through clustering, to evaluate exogenous variables and even the endogenous variable from the semantic nature they composed of. Based on the “Moto”, TAKE, publication title and abstract analyzed taken from the reference manager while the last one from AJAE. With this premises using 894 keywords from AJAE in dimensions database, thirty topics generated by LDA and word cloud for those keywords given in Figure 18. As, word cloud implies those publication can be characterized by topical contents that are very coherent with words like economic, market, risk decision, model, agricultural etc and the importance of topic modeling lays on communicating of most salient Since, keywords are dependent to the topic of interest, mimicking past topic of interest using keyword needs time treatment and besides the frequency of keywords, length of words as demonstrated by Term Frequency Invers Document Frequency (TFIDF) [26].
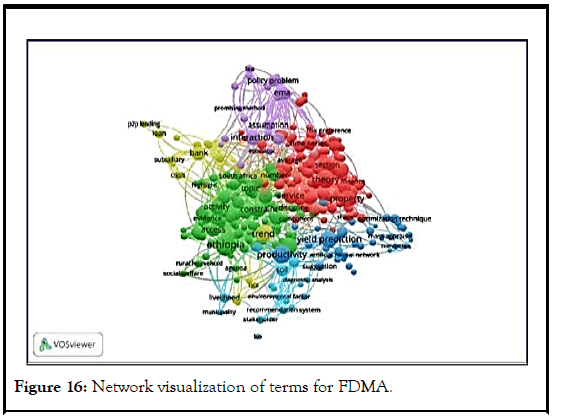
Figure 16: Network visualization of terms for FDMA.
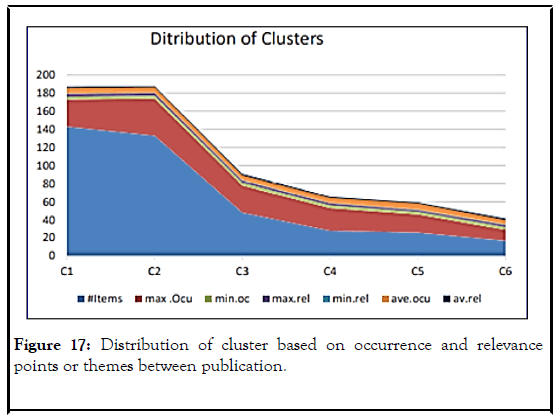
Figure 17: Distribution of cluster based on occurrence and relevance points or themes between publication.
Topic 1 ('cost' 'supply' 'decision' 'process' 'demand' 'marginal' 'choice' 'chain' 'consumer').
Topic 16 ('rate' 'capitalization' 'mathematical' 'interest' 'corporation' 'context' 'microfinance' 'identification' 'loan').
Topic 30 ('time' 'factor' 'service' 'cost' 'outcome' 'phenomenon' 'hectare' 'sensitivity' 'wage').
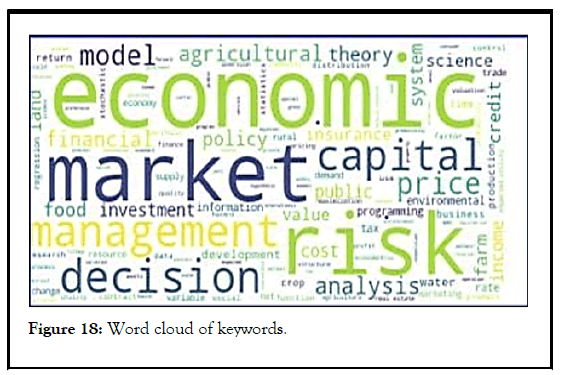
Figure 18: Word cloud of keywords.
Since, keywords are dependent to the topic of interest, mimicking past topic of interest using keyword needs time treatment and besides the frequency of keywords, length of words as demonstrated by Term Frequency Invers Document Frequency (TFIDF).
Evaluation of topic model is based on some metrics as has been demonstrated in „tmtoolkit‟ and this can be used to find a good hyper parameter set for a given dataset, e.g. a good combination of the number of topics and concentration parameters (alpha and beta) defined in section. Since keywords here are simply list of word and fail to define texts making topic evaluation is nonsense while for title and abstract it makes sense. Given k number of topic, the prior concentration parameter over the document specific topic distributions, α, is then equal to 1/k and the document topic density in this case is 0.033 and implies that documents (here keywords) are with fewer topics as would expected and with no surprising the topic-word density (beta/eta) also small.
Topic modeling using LDA for Scikit implementation therefore gives six topics for those 280 (192) training dataset publications as demonstrated in Figures 19 and 20. LAD performance using Scikit learning determined by calculating perplexity or predictive likelihood for and β equal to 0.01 that gives 65.109 (32.0) if topics are six (left side of figure 20) otherwise perplexity is 192 (90.32) if eight topics propose. Though it helps to determine optimal number of topic by measuring in what way model is able to predict, perplexity is less correlated with human opinion and for a model to be satisfactory, predictive likelihood should be low in contrast to log likelihood score, which are essential to compare different models at large value. The print‟ package gives model parameters for values to log likelihood to be -15628.26 (-151455.78) and perplexity of 3399.04 (6767.768) with learning decay rate that control the learning rate as 0.7 for those number of components/topics (six). The learning method was online with learning offset (down weigh early iteration) of 50, none document topic, and topic word prior with total sample size 1000000 and 0 verbose in both case. The result obtained from perplexity plot implies that only the lower limit (for title) gives optimal topics, though is not yet smooth, hence, coherent score instead is preferable while since Scikit learn package implementation of LDA does not provide this method to measure coherence score, genism package from NLP deployed. Figure 19 therefore displays distribution of topics to words obtained from those 353 (241) publication at which, for instance, terms like “research" + *"risk" + *"agricultural all contribute equally to second topic (topic 1, since python starts counting from zero) with weight of 0.027 to each in the title case.
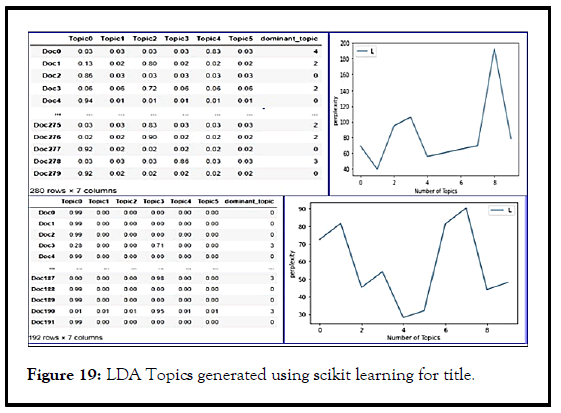
Figure 19: LDA Topics generated using scikit learning for title.
These terms/words for topic modeling based on abstract however contribute differently to each topic, like for instance term risk weights about 0.022 for topic 2, research weigh 0.007 and 0.006 in topic 0 and 4 while term agricultural contributes to topic 0 and topic 2 with weight of 0.006 and 0.0011 respectively. This is one advantage of topic modeling in obtained single term with different topics, but with different contribution, compared to clustering in bibliometric analysis done so far. Furthermore, due to having, different distribution for topics in a document, obtaining topics that are dominant in topic modeling is an easy task at which topic 2 is most frequent and dominant topic for title based topic modeling as observed in Figure 26. In the same token, dominant topics for abstract based modeling reports that topic 0 and topic 3 exclusively dominates to all documents. For validation purpose, coherence score now easily determined as 0.4221 (0.28) by importing coherence model from genesis models. An essential thing in this analysis is there is no any outlier for publication, since no negatively indexed topic, as experienced in BerTopic package, whereas these six topics can be coined to some scheme of research to the problem surveyed. For instance, topic 0 (in the case title based modeling, TM_T) tries to signify how to model agricultural problems particularly to food security at which various inputs highly affect modeling process (input takes relatively higher weights, 0.028). It farther conveys loosely importance of econometrics (0.013) modeling methods to handle uncertainties regarding to the problem indicators (0.018) whatever the approach (0.0021) is positivistic or normative. On the other hand, topic 1, can be generalized as how to agricultural research should be conducted particularly at the farm level than sectorial level where risk whether at systematic or unsystematic and or at perspective of finance and idiosyncratic risk for crop yield due to output uncertainty to both case. With similar fashion to remaining topics and topics from abstract (TM_A column), a rough generalize made to those six topics as Table 6 which, however, further solidified by pining terms that are more prevalent.
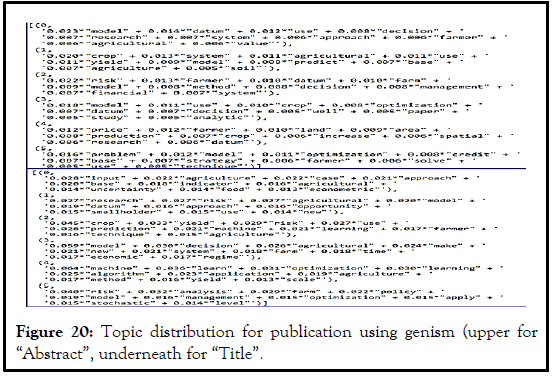
Figure 20: Topic distribution for publication using genism (upper for “Abstract”, underneath for “Title”.
| Topic | TM_T | TM_A |
|---|---|---|
| 0 | How to model agricultural problems particularly to food security | Systemic approach and modeling in agricultural decision |
| 1 | How to conduct agricultural research predomi nantly at farm level and approaches | Agricultural System Modeling and Crop yield Prediction (ASMCP) |
| 2 | Role of machine learning in agriculture to predict crop yield | Farm Risk Modeling and Farmer Financial Decision (FRMFFD) |
| 3 | System modeling in agricultural decision making and challenges of farm economic scenarios | Crop Production Optimization Modeling and Analytical Decision (CPOAD) |
| 4 | Application of machine learning and optimization methods in agricultural economic scale improvement | Farmer Crop Production Acreage Allocation and Spatial Prices (FCPAASP) |
| 5 | Farm management and risk optimization modeling for policy analysis | Farm Optimization Model Under Credit Constraint (FOMUCC). |
TABLE 6: Generalization of topic to their central scheme
Model improvement and justification
Those topics obtained from genism package are based on the default value of LDA parameters (α=0.1, β=0.01)that are actually either symmetric or asymmetric distribution at which for the first case a higher alpha (beta) documents (topics) are made up of more topics (words) and vice versa. In the case of asymmetric distribution, higher alpha (beta) results in a more specific topic (word) distribution per document (topic). In general, higher alpha values mean documents contain more similar topic contents. The same is true for beta, but with topics and words: generally, a high beta will result in topics with more similar word contents and a general recommendation has been forwarded as asymmetric alpha is helpful, than asymmetric beta. In the case of genism, the default value for alpha is 'symmetric. This means that the value for alpha is uniform for each topic and each topic is evenly distributed throughout a document unlike asymmetric distribution (as measured by skewness) where certain topics would be favored over others. The formula which genism uses to calculate the symmetric value for alpha is to divide 1.0 by the number of topics in the model. For this and as improvement of genism based LDA implementation, improving the LDA topic modeling by defining supporting function as Def compute_coherence_values (corpus, dictionary, k, a, b) for k-number of topic, and hyper-parameter α=alpha β=beta. This supporting function then runs by setting the minimum and maximum range of topic. Table 6 then displays an optimal number of topics with respect to asymmetric and symmetric hyper parameter values (α=asymmetric, β=symetric) with coherence score of 0.4315 and number of topic therefore now become five. As can be seen from the snip sheet, one essential contribution of asymmetric alpha in contrary to LDA that assume common Dirichlet prior distribution is to identify dominate topics along their percentage contribution in the document. While distribution of document word counts seems uniform in Figure 22, distribution of document word counts by dominant topic instead is skewed as portrayed in Figure 23. This signifies how topic distribution rather distributed disproportionately in publication, and is expected actually, since, there always exist no indifference to central scheme of publications certainly. Dominant topic in a document implies the central theme of the publication that is latent in fact while publication in this analysis, however, are truth sets, since number of relevant themes can be known a priori and hence implementation of LDA therefore confirmed valid in this analysis. This is because literatures in agricultural decision making have been relatively structured particularly related to approaches and purpose of modeling. For instance, regarding to purpose of modeling in agriculture, the two most approaches are (as confirmed normative and positive approaches that can, however, be decomposed into various models. Whereas to account nature of problem domain leads classification of agricultural modeling either as deterministic or stochastic while incorporating adaptive behavior of farmers as agents mostly recommended through using theory of utility function (Table 7).
| Topic | Coherence value | Alpha value | Beta value | |||
|---|---|---|---|---|---|---|
| 0 | TM_T | TM_A | TM_T | TM_T | TM_A | |
| 0.3956 | 0.2529 | 0.01 | 0.01 | 0.01 | 0.01 | |
| 1 | 0.4031 | 0.2441 | 0.01 | 0.01 | Symmetric | Symmetric |
| 2 | 0.377 | 0.264 | Symmetric | Asymmetric | 0.01 | 0.01 |
| 3 | 0.3968 | 0.2685 | Symmetric | Symmetric | symmetric | symmetric |
| 4 | 0.4179 | 0.2657 | Asymmetric | symmetric | 0.01 | 0.01 |
| 5 | 0.4315 | 0.2571 | asymmetric | asymmetric | symmetric | symmetric |
| 6 | 0.3946 | 0.2499 | 0.01 | 0.01 | 0.01 | 0.01 |
| 7 | 0.3996 | 0.2454 | 0.01 | 0.01 | Symmetric | Symmetric |
| 8 | 0.4026 | 0.2548 | Symmetric | Symmetric | 0.01 | 0.01 |
| 9 | 0.4076 | 0.2586 | Symmetric | Symmetric | Symmetric | Symmetric |
| 10 | 0.411 | 0.2448 | Asymmetric | Asymmetric | 0.01 | 0.01 |
TABLE 7: Coherence score and hyper parameters for topics using genism LDA using title and abstract
This is however, should not be considered as sufficient classification of literatures in agricultural decision making at which most of the time studies completely focused on investigating either on the agent’s decision making preference and or production function. This can be justified using keywords of the various topics extracted, as for instance the term theory in topic 0 clearly signifies the importance of various theories in the problem domain that includes among other, theory of Firm, production theory and consumption function all which designed for the purpose of making viable decision making. This particularly expected in agricultural decision making that best characterized by risk as demonstrated in topic 1, which is highly weighted in the topic. Furthermore, the difference in terms (keyword’s) weight clearly convey themes of the publication say for instance, though keyword “model” appears in both topic 0 and 1, it receives different weights due to the orientation of underlying to pics. Explicitly, in the first case it is theory that more matters than models, though it is an immediate issue to be considered, for general case while it comes next to farm when risk is specified to agricultural decision. Similarly, analysis for other terms in and reaming topics can be mad while the important term issue especially to this investigation is the term credit in topic 1 that is composed from term starting risk to stochastic, highest to lowest weightage, that implies, when compared to other terms, something essential to examine critically. This is because that most of studies in agricultural decision making are more ignorant for direct and or explicit consideration of financial problems despite of severing impact especially to households. This is justified by Figure 25 that demonstrated most discussed topics in the document or publication retrieved and no terms that indicate financial decision like credit or debit appear. The 2D plot of topic using pyLD Avis in Figure 24 is based on the dimensionality reduction methodology, Principal Component Analysis (PCA) and there is only one overlap of topics (topic 2 and topic 4) whereas topic one found as more prevalent one as it makes up biggest portion of topic being talked about amongst documents (38.8%, upper part of Figure 24). Similarly it is topic one again (but different topic here) that is more prevalent (37.3%, lower part of Figure 24).
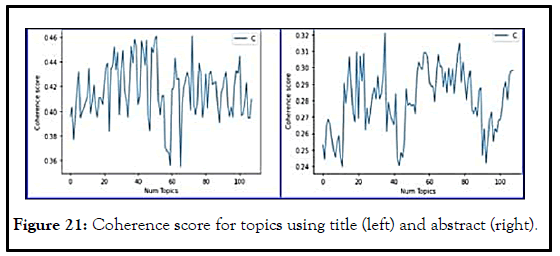
Figure 21: Coherence score for topics using title (left) and abstract (right).
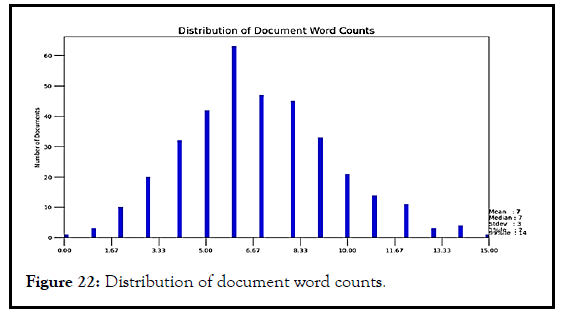
Figure 22: Distribution of document word counts.
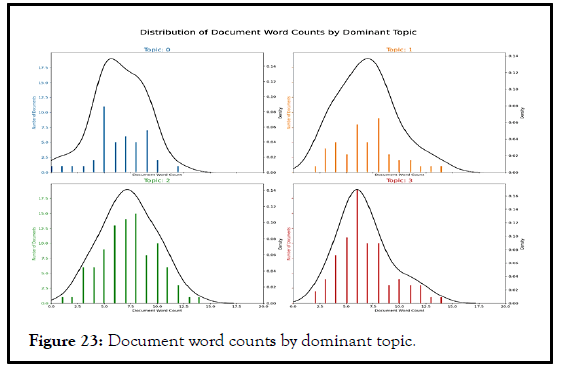
Figure 23: Document word counts by dominant topic.
Interpretation of clusters as knowledge mapping and structuring
As reported by the Integrated Farming (IF) as the whole farming approach and Integrated Crop Management (ICM) or Integrated Production (IP) as holistic approach rooted from in Integrated Pest Management (IPM). Without losing generality, this can be generalized by the taxonomy proposed by using building blocks of:
G×E×M×S,
For geno type=G, Environment, E, Management, M and Socioeconomic, S paradigm of international crop production. Conceptual model G×E×M is based on biophysical variables that directly determine crop growth, and their interaction whereas since these biophysical variables are under highly influence of Socioeconomic factors (S) like supply and demand of input/ outputs, finance and credit, agricultural policies and the adaptive practice. Hence, G×E×M×S can be a special case of bio-economic model. Thematically, research activity in agriculture, however, broadly generalized as either technological improvement or informational. Distribution of clusters enhancement with the first is mainly through agronomy, soil science, pathology, and entomology while agricultural economics and farm management contributes to the latter and this fits with the paradigm of the three way interaction E×M×S. This approach, almost but not completely, similar to the two main strands of David Gibbon regarding Farm System Research (FSR), one is about the fundamental to the field of FSR while the second and more emphasized was the methodological element seen from LERN group and Agricultural Knowledge and Information System (AKIS) group. Another perspective of farm modeling from the perspective of Cluster (C1) is underlying of interaction and relationship that leads scope of farming to either farm level or territorial or sector level. According to Strauss, et al., the latter is more facilitated by econometric modelling to assess market price and policy and hence are instruments of strategic decision, despite statement given so far, this an optimization methods and the normative approach it is. From purpose of modeling to C1, normative and positive approach has been frequently cited in agricultural decision literatures while mentioned: mathematical programming, mathematical statistics, production functions, input-output analysis and network analysis to Richardson on his book, Simulation for applied risk management; on the other hand describe positive approaches as a non-optimizing approach to farm simulation models to answer the positive question of what is the likely outcome than the normative answer what ought to be with regard to FSR proposed three stage of generation while added the fourth one: (i) The nature of reality (ontological beliefs); (ii) The nature of knowing and knowledge (epistemological beliefs) (iii) The nature of human inquiry (methodological assumptions) and (iv) The nature of human nature assumption of preference. Particular to adaptive decision in farming activity, bio economic and bio decisional approaches have been device while, as noticed by unless utilizing models that potentially capture salient feature of the uncertain farming environment, making efficient decision and recommending for viable policy direction is impossible. According to Robert, et al., both tactical and strategic decision should be adaptively addressed to take into account the dynamic nature of the problem and as described in the introductory section to the best of policy direction both prediction and decision modeling are worthwhile. Moreover, the operational decision is more complex in agricultural decision making to reach on common agreement due to variation in managerial skill and cognitive knowledge to operational decision making. It is openness along it being polycentric, when seen from financial relationship and institutional perspective, agricultural the nested hierarchy of governance affects the operational decision. For example, rules defining the amount and timing of fertilizer application on a field and the timing of debt return and credit receiving even contained in and affected by the rules at a higher collective choice level of decision making of course higher collective choice rules are also contained in and affected by higher level of decision making, the constitutional choice level. This operational decision challenge in modeling approach of C1 along with the essence of C2, shows how each of the cluster linked and it is risk as a triggering factor whatever the form of risk it be, production, risk, market risk, or financial risk for instance, has challenging farm level decision making. Since risks are due to those uncertain events in farming activity, the usual understanding of risk modeling in this case has dominantly been practiced by attaching probabilities to those uncertainties. Besides the pitfall of attaching risk and uncertainty respectively to known and unknown probabilities, the subjective nature of probabilities to decision maker where the attitude of ambiguity along with concept of ignorance has been considered as a measure of degree of confidence in the estimate of probability. Based on the desk review of the working paper authors of these survey generalize the issue of risk and uncertainty into the case of 2P to account both probability and possibility in the decision making process. One important attribute of adaptive modeling therefore is to realize the ignorance when new information imputed to the instrument as it helps to establish close relationship between reflection and action. Another critical issue in this schema is the possibility of incorporating financial risk especially to those that are credit constrained farmers and hence accounting the two most, keeping dynamics in belief and preference of farmer as decision maker, risk in agriculture: Risk aversion and downside risk. Farm financing as strategy of risk sharing on the other hand, however, magnifies risk unless optimal and viable financial structure exist, and two common problems in this regard, adverse selection and moral hazard due to informational asymmetry, therefore should be addressed during modeling process in order not to bear both type-I and type-II error. It is theory of utility from lender and borrower preference perspective seems viable in this case which however been elicited through the concept of Certainty Equivalence (CE) that better defines the problem at quadratic programing and a normative approach. C3’s are more about advanced optimization methods and techniques than the importance of optimization problem in C2, as indicated by term Ethiopia and Malawi, in the problem domain. This is can be further justified by the terms coined in the cluster and including Neural Network (NN),deep uncertainty, hyper parameter in the area of Machine Learning (ML) and Hyper Parameter Optimization (HPO) to imply how problem in the agricultural study are being addressed in developing countries. It further tries to show status of agriculture in general, the era of Agric 4.0 and farming in particular where role of Internet of Thing (IOT) have been emphasized and generalized as precision agriculture. Similarly an in-depth analysis for remaining clusters may not be economical as far as each of them in one or another way are touched theoretically by those discussed while C5 in its especial case, however, is very critical as far as policy direction is demanded. This is because of the potential of Exploratory Modeling (EM) in giving robust formulation that might lend itself for flexible analysis of the decision process compared to the consolidative approach. Farming activity, bio economic and bio decisional approaches have been device unless utilizing models that potentially capture salient feature of the uncertain farming environment, making efficient decision and recommending for viable policy direction is impossible. According to both tactical and strategic decision should be adaptively addressed to take into account the dynamic nature of the problem and as described in the introductory section to the best of policy direction both prediction and decision modeling are worthwhile.
Moreover, the operational decision is more complex in agricultural decision making to reach on common agreement due to variation in managerial skill and cognitive knowledge to operational decision making. It is openness along it being polycentric, when seen from financial relationship and institutional perspective, agricultural the nested hierarchy of governance affects the operational decision. For example, rules defining the amount and timing of fertilizer application on a field and the timing of debt return and credit receiving even contained in and affected by the rules at a higher collective choice level of decision making of course higher collective choice rules are also contained in and affected by higher level of decision making, the constitutional choice level. This operational decision challenge in modeling approach of C1 along with the essence of C2, shows how each of the cluster linked and it is risk as a triggering factor whatever the form of risk it be, production, risk, market risk, or financial risk for instance, has challenging farm level decision making. Since risks are due to those uncertain events in farming activity, the usual understanding of risk modeling in this case has dominantly been practiced by attaching probabilities to those uncertainties. Besides the pitfall of attaching risk and uncertainty respectively to known and unknown probabilities, the subjective nature of probabilities to decision maker where the attitude of ambiguity along with concept of ignorance has been considered as a measure of degree of confidence in the estimate of probability. Based on the desk review of the working paper authors of these survey generalize the issue of risk and uncertainty into the case of 2P Preprint to account both probability and possibility in the decision making process. One important attribute of adaptive modeling therefore is to realize the ignorance when new information imputed to the instrument as it helps to establish close relationship between reflection and action. Another critical issue in this schema is the possibility of incorporating financial risk especially to those that are credit constrained farmers and hence accounting the two most, keeping dynamics in belief and preference of farmer as decision maker, risk in agriculture: Risk aversion and downside risk. Farm financing as strategy of risk sharing on the other hand, however, magnifies risk unless optimal and viable financial structure exist, and two common problems in this regard, adverse selection and moral hazard due to informational asymmetry, therefore should be addressed during modeling process in order not to bear both type-I and type-II error. It is theory of utility from lender and borrower preference perspective seems viable in this case which however been elicited through the concept of Certainty Equivalence (CE) that better defines the problem at quadratic programing and a normative approach. C3’s are more about advanced optimization methods and techniques than the importance of optimization problem in C2, as indicated by term Ethiopia and Malawi, in the problem domain. This is can be further justified by the terms coined in the cluster and including Neural Network (NN),deep uncertainty, hyper parameter in the area of Machine learning (ML) and Hyper Parameter Optimization (HPO) to imply how problem in the agricultural study are being addressed in developing countries. It further tries to show status of agriculture in general, the era of Agri 4.0 and farming in particular where role of Internet of Thing (IOT) have been emphasized and generalized as precision agriculture. Similarly an in depth analysis for remaining clusters may not be economical as far as each of them in one or another way are touched theoretically by those discussed while C5 in its especial case, however, is very critical as far as policy direction is demanded. This is because of the potential of Exploratory Modeling (EM) in giving robust formulation that might lend itself for flexible analysis of the decision process compared to the consolidative approach.
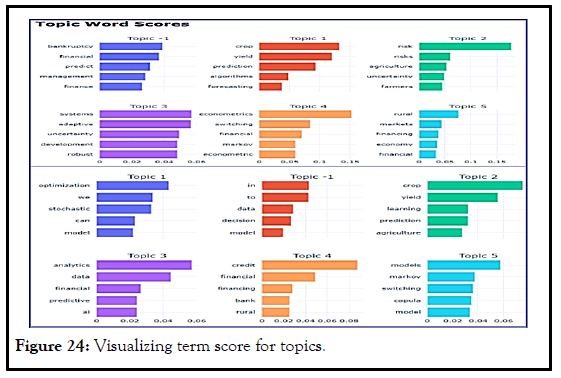
Figure 24: Visualizing term score for topics.
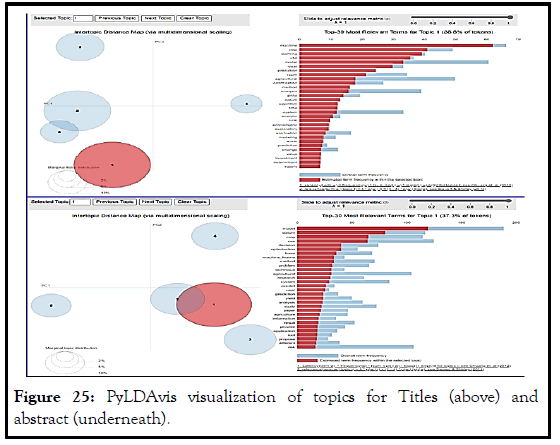
Figure 25: PyLDAvis visualization of topics for Titles (above) and abstract (underneath).
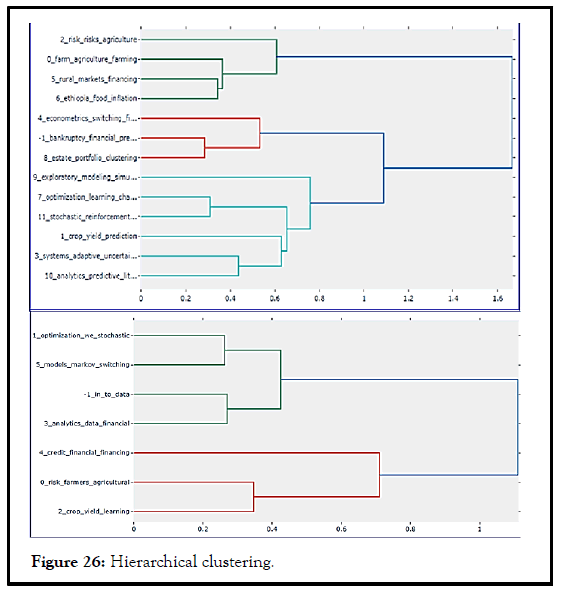
Figure 26: Hierarchical clustering.
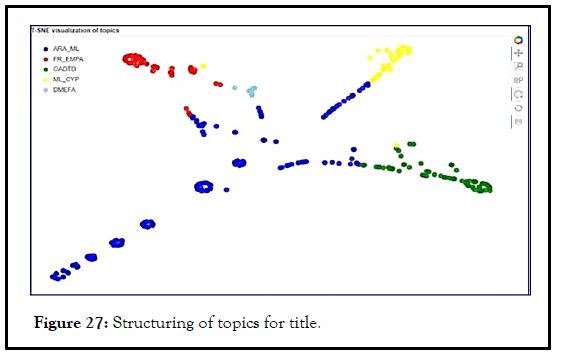
Figure 27: Structuring of topics for title.
Note: ARAML: Agricultural Research Approach using Machine Learning; FREMPA: Farming Research and the importance Exploratory Modeling for Policy analysis; OADTD: Operational Analysis and Decision to Technological Development; MLCYP: Machine Learning Based Crop Yield Prediction; DMEFA: Decision Making based on Explanatory Factor Analysis.
In this regard discussed, in depth, for three important agents: Explainable agency, normative agency and justifiable agency. Each respectively meant that agency (model):
• Can provide, on request, the reasons for its activities.
• If, to the extent possible, it follows the norms of its society.
• If, it follows society’s norms and explains its activities in those terms.
This and the scientometric analysis result depicted demonstrates trend of solution approach, whatever the approach a decision maker has to follow, today is the era of big data and it is data science, mining and information extraction through the application of artificial intelligence AI matters. This is a remarkable development in decision making particularly for breaking the fuzzy boundary between positive and normative approach, i.e., neither purely normative nor positive approach exist. These two stream of standard branches, however, are methodological vector on the orientation and process to the theory of the firm whereas this investigation is to the most three theory of firm: (i) Managerial economic; (ii) Behavioral economics and (iii) Transactional economics which all acknowledges uncertainties to nature of environments and concept of empirical study. Since, focus in this investigation is for farm financing decision particularly to crop production, of the available literatures are a generalization of production modeling approach for farming by as:
• Utilization of representative farm model, commonly known as
Representative Farm Aggregate (RFA) model.
• Econometric models.
• Econometric based neoclassic models seems sound.
Nevertheless, we rather found better insight from Pettit’s discussion that generates three broad generations for both labeling as:
• Econometric Model Based on Statistical Inference (EMBIS).
• Programing models (mathematical programing, MP).
• General Simulation Models (GSM).
Starting from their realization in the 1920’s EMBIS have shown an impressive progress and appeal for some objectivity with care for not overstating to not account as optimization methods. On the other hand, as is obvious that mathematical programing emerged formally in the 1940’s their utilization for agricultural problem began in the 1950 and vaguely continue tills 1960’s. Comparatively, MP model help to organize a huge mass of information coherently better than EMBIS whereas GSM model that appeared in the late 1960 is with primary advantage of entailing both data flexibility and mathematical structure (Table 8).
| Cluster | Top occurred terms | Top relevant terms | Implication of top occurance | Implication of top relevant | Generalized implication |
|---|---|---|---|---|---|
| C1 red balls | Theory | CTFM (3.14) | How approaches and methods should followed | Dynamics of finacial modeling | How modeling approaches should be procedures and attributes of modeling. |
| service | Systems practice (2.36) | Role and contribution of the deliverables | How practices at system level should be realized | ||
| Prescriptive analytics | Learned policy (1.7644) | How birding prediction and decions is important | The importance of having flexible policies | ||
| Scinece | Iso (1.76) | The need of exploring new paradigm | The importance of standardization | ||
| Ackoff | Sdp (1.723) | Wholes is greater than sum of individual | How real world problem is both random and dynamics | ||
| Time series | Causal effect(1.6734) | Trend effect and causality | The importance of explanatory and exploratory | ||
| Modeling | Agricultural enterprise (1.647) | Realizing and capturing realities | How agriculture could be a potential source of business | ||
| Reign | Financing efficiency (1.5575) | The importance state of natures | Issue off financial problems | ||
| Scenario tree (1.4844) | There always exist more than one way | ||||
| C2-Green balls | Ethiopia | Distressed debt (2.4176) | How agriculture still plays vital role in Ethiopians economy | How likely the farm financing is banckptcy and the need of hedging | Farm modelling and implication of financial leveraging |
| Crop yield | Price fluctuation(2.2638) | An explanatory variable | How households income highly dependent to crop yield | ||
| Topic, constraint | Bankrapcy (2.1876) | How decisions modeling is important and is topic specific infect | Implies how uncontrollable factor and unforeseen circumstances should be treated in farm financing | ||
| Firm, inflation, innovation | Representative farm (1.776) | The importance of exogenous variable in theory of firm | Indicates the research approaches for farming in the 1960’s at firm and aggregate supply perspectives | ||
| Credit, accessed advisor | Small scale irrigation (1.6953) | Farming input, their access and means | Mitigation approach of production risk | ||
| Adaptation | Farm modeling (1.6762) | How natural variation influent farm decision | The need of | ||
| Househol, risk management, extension and supply | Farm level modeling (1.6555) | Micro level economic modeling | The importance of farm financing modeling at microvolt | ||
| C3–blue | Productivity | Portfolio management (2.3726) | General objective of any study | How farm decision can correlated to investment decision | How recent approaches in AI are attracting the farm financing decision |
| Yield prediction | Anfis (41.8765) | Farm income determination is most likely dependent to yield determination that is exogenous to farmer | The contemporary dependent to yield determination that is exogenous to farmer | ||
| Neural network | Livestock production (1.7938) | ||||
| Optimization technique | Food production (1.7734 | ||||
| Multilayer perceptron (1.725 | |||||
| Machine learning algorithms (1.6442) | |||||
| C4-Yellow | Trend | p2p lending (2.2682) | Both crop yield and financial results can be attributed with time variation | Besides formal source of financing informal fencing also common | Source of farm financing and major attributes of financing |
| Bank | Slice (2.2682) | Major source of formal financing is through banking | |||
| Support | Interbank market (1.6232) | Farm financing is polycentric and is open system that should be facilitated through advising for instance | The importance of global networking in financial institution | ||
| Loan | Lending (1.6232) | An alternative source constrained farmers | Primary business line of financial institutes | ||
| Subsidiary (1.5656) | Agriculture as business unit needs a policy that considers income sustainability | ||||
| C5-Purple | Interaction | Mediterranean region (1.7492) | Conveys presence of multiple actors in problem domain | Spatial and temporal perspectives of farm moiling | Exploratory modeling and policy analysis |
| Adaption | This is to implied how agronomic perspective of farming activities | ||||
| Exploratory modeling, policy problem | The importance of robust/ flexible modeling in policy design | ||||
| Deep uncertainty | Farming decision is more than revealing risk based on probabilistic nature of the state the world | ||||
| C6-Aqua | Soil | Bio (2.258) | The need of correlating spatial and temporal component of agriculture | Most suffices to the natural attributes and analogy | Representative Farm aggregate modeling (RFA-model) |
| Community | Agricultural production planning (1.9561) | Farm decision making process is highly dependent on the communities economic status | In today’s farming farm level decision more is more of specific and hence farm level than RFA | ||
| Livelihood | Amara regional state (1.487) | Critically farmers lives majorly correlated with farm productivities | It is clearly evidential for the region to relief the livelihood of the community on farming activity |
TABLE 8: Clusters and expected schema
Using the scientometric and topic modeling as methods of extracting knowledge to the state of art of farm financial decision, distinct publication analyzed. For the analysis publication source retrieved from database, API and reference manager in terms of bibliometric, network and text data. The analysis majorly done for title, abstract and keywords of publication for the purpose of extracting knowledge and identifying research schema on the problem and it is the scientometirc analysis deployed for this case mainly based on bibliometric analysis. Using bibliometric analysis and the resulted visualization map through co-authorship, co-occurrence and citation interest of scholars and organization captured to the problem domain particularly word co-occurrence analysis emphasized since it uses field of study as analysis unit that helps to distinguish the focus of publication under investigation. Importance of co-occurrence analysis found essential via cluster output of keywords to indicate the schema or taxonomy of research interest while by cluster analysis any keyword supposed to a single cluster and hence to avoid such binary effect a topic modeling deployed. By topic modeling, the advantage of Natural Language Processing (NLP) realized here to complement the traditional literature review called systematic literature review. Topic modeling mainly as method of unsupervised classification of publication utilized not only for clustering of keywords but also for semantic analysis. Since it can scan set of documents and detect word and phrase patters words in this approach found to any proportion than either unity or null. Among popular topic modeling types utilized in this survey includes Latent Dirchilate Allocation (LDA) and BerTopic topic modeling at which the first is mainly for topic generation and the latter is for post topic analysis. In both cases, the analysis made with those most packages like genism and scikit learn from python platform to facilitate the analysis and make clear the visualization topics. Started with dictionary and corpus preparation, the generated model from LDA evaluated with perplexity and coherent analysis and followed by improvement of topic using BerTopic particularly for similarity and hierarchical clustering. Finally, using clusters obtained from both analyses, discussion and interpretation made to state of art of farm financing and the finding signifies that besides the traditional bio economic models that is very prominent particularly to agricultural decision modeling, incorporating the emerging technology like internet of things, Machine learning, data mining found critical to today‟s agricultural development where precision agriculture has been demanded. With this development progress and issues related to financial decision found with little concern and few papers tried to incorporate it as direct decision variable as confirmed from the result of both scientometric and topic modeling analysis. It is straightforward to acknowledge finical problems to consider as decision variable by describing their effect and making exploratory analysis to such financial turmoil environment.
[Crossref] [Google Scholar] [PubMed]
[Google Scholar] [PubMed]
[Crossref] [Google Scholar] [PubMed]
Citation: Achamu G, et al. Scientometric analysis and topic modeling for Farm Financial Decision Modeling (FFDM). AGBIR.2024;40.1142-1159.
Received: 07-Feb-2023, Manuscript No. AGBIR-23-88979; , Pre QC No. AGBIR-23-88979 (PQ); Editor assigned: 09-Feb-2023, Pre QC No. AGBIR-23-88979 (PQ); Reviewed: 23-Mar-2023, QC No. AGBIR-23-88979; Revised: 21-Apr-2023, Manuscript No. AGBIR-23-88979 (R); Published: 29-Apr-2024, DOI: 10.35248/0970-1907.24.40.1142-1159
