An International Journal
Agricultural and Biological Research
ISSN - 0970-1907
RNI # 24/103/2012-R1
RNI # 24/103/2012-R1
Review Article - (2023) Volume 39, Issue 4
Cancer is a leading cause of cancer-related deaths affecting millions worldwide. Early detection and accurate diagnosis of cancer can significantly improve survival rates. Machine learning algorithms have shown great potential in predicting cancer risk analysis. In this research paper, we compare the performance of two popular algorithms, the Rotation Forest Algorithm and the Support Vector Machine Algorithm, for predicting cancer risk analysis. The datasets used for this study are from the UCI Machine Learning Repository. We randomly split each dataset into training and testing sets and evaluated the algorithms' performance using accuracy, precision, recall, specificity, and F1 score. Our results showed that the Rotation Forest better performed SVM on most datasets. The average enhancement is around 4.67%. It is observed that the RF approach also enhances classification performance. Using hypothesis tests, such as the Wilcoxon rank sum test and t-test, it was determined that the alternative hypothesis was true.
Cancer risk analysis; Machine learning; Rotation forest algorithm; Support vector machine; Feature selection
The real-world data contains irrelevant or meaningless data termed noise which can significantly affect various data analysis tasks of data mining [1]. The erroneous training data results in a classifier's low classification performance, increasing the algorithm's time complexity [2]. Several researchers have proposed various techniques for data cleaning. Those techniques include neural networks and filters. The mechanism of assistance for clinical decision-making has become the medical profession's core atmosphere in recent years for doctors to offer help for medical diagnosis [3]. Health background classification relies on studying a better level of DSS in medical care from various health sources [4,5]. Cancer is a significant public health concern internationally, with a likely 19.3 million new cases and 10 million deaths in 2020. Early detection and prevention are crucial in reducing cancer mortality rates. ML algorithms have shown promise in predicting cancer risk analysis using various biomarkers and clinical features. In this paper, we compared the performance of the Rotation Forest and SVM algorithms on five cancer-related datasets from the UCI Machine Learning Repository. Cancer risk prediction is a crucial area of research in healthcare, as early detection and treatment can significantly increase the chances of survival. Machine learning algorithms have shown promise in accurately predicting cancer risk, allowing for early intervention and prevention measures to be taken.
Two such algorithms are the RF and the SVM algorithms. The RF algorithm is an ensemble learning method that combines the outputs of multiple decision tree classifiers. In contrast, the SVM algorithm is a popular classification algorithm that uses a hyperplane to separate different classes. In this analysis, we have compared the performance of these two algorithms in predicting cancer risk. Specifically, we have used a dataset containing patient information, including demographic information, lifestyle factors, and medical history, to train and test the algorithms. The goal is to accurately predict whether a patient is at high or low risk for developing cancer. By comparing the two algorithms' accuracy, precision, recall, and F1-score, we have determined which algorithm is better suited for predicting cancer risk and potentially informed clinical decision-making. This research paper is organized as follows: In Section 2, related works. In Section 3, the proposed methodology, In Section 4, Experimental Setup and Results are discussed. In Section 5, the conclusion of this research is presented.
The literature review provided an overview of the existing research on predicting cancer risk using machine learning algorithms. It has included a discussion of the advantages and limitations of the RF and the SVM algorithms and other commonly used machine learning algorithms. The review also identifies the variables and risk factors commonly used in cancer risk prediction models.
In recent years, machine learning algorithms have gained popularity in predicting cancer risk using clinical and demographic features. Among these algorithms, the Rotation Forest algorithm and SVM algorithm have been widely studied and implemented. The RF algorithm, introduced by Rodriguez et al., [6], is an ensemble method that combines multiple decision trees by randomly dividing the feature set into subsets and training decision trees on each subset. This helps to improve the diversity of the decision trees and reduce overfitting. The Rotation Forest algorithm was used to predict the risk of lung cancer using demographic and clinical features, achieving an accuracy of 84.5% [7]. The authors demonstrated an efficient approach for detecting and classifying lung cancer by exploiting CT scan images. They were working on seven machine learning models [8]. In a study, SVM was used to predict the risk of lung cancer using radio mics features extracted from CT images, achieving an accuracy of 78.9%. The SVM algorithm was used to predict the recurrence of breast cancer. The results showed that the SVM algorithm had a higher accuracy than other ML algorithms [9,10].
The authors applied Patra [11] NN's, SVM, radial basis function network, naive Bayes, etc., in order to predict lung cancer. They showed that the radial basis function network achieved a higher accuracy of 81.25% on lung cancer data. Additionally, the key objective is the primary analysis of lung cancer by investigating the performance of classification algorithms [12]. The authors applied classification algorithms such as SVM, DT, LR, NB, etc. In the lung cancer dataset from the UCI, the LR achieved higher accuracy of 96.9. They compared the performance of SVM, RF, and NB algorithms in predicting lung cancer risk using demographic and clinical features. The results showed that the SVM algorithm had the highest accuracy of 86.9% [13]. Liver-based disorders cause mortality to increase worldwide. Herein, alcohol consumption is entirely related to liver cirrhosis and liver cancer. The death rate connected to alcohol-based liver disorders decreases if the disease is detected early. Besides, heart disease gives rise to heart attacks that result in death [14]. Furthermore, this paper Atrey et al., [15] established their predictions on only ten cytological attributes. Another breast cancer study introduced an ML-based DSS, combined with random optimization for classifying primary breast cancer patients into two risk groups of progression.
This paper used publicly available datasets of 165 and 535 clinical patients for Hepatocellular Carcinoma (HCC) survival analysis, the most common kind of liver cancer [16]. It was a binary classification problem in both cases: whether the patient will die (0) or survive (1), indicated by a one-year outcome evaluation liver disease study showed that the J48 decision tree algorithm could be beneficial in this topic with 0.507 mean absolute errors [17,18]. The authors used the Indian Liver Patient Dataset, which contains 583 patients. Like in most previously mentioned papers, Yuan et al., [19] the predictions were also based on a few attributes and did a thorough lung cancer analysis (classification and survival analysis) using a dataset of 76,643 patients. The authors Xie et al., [20] designed a mechanism to identify the appropriate biomarkers for early lung cancer diagnosis by combining established metabolomics mechanisms and data mining algorithms. Their study was based on a dataset of 110 lung cancer patients and 43 healthy participants. Among the assessed models, NB is the suggested one for the primary prediction of lung tumors.
Overall, these studies demonstrate the effectiveness of the RF and SVM algorithm in predicting cancer risk based on a variety of input data. While both algorithms have their advantages and disadvantages, they have shown promising results and are likely to continue to be used in cancer risk analysis and other healthcare applications [21].
The methodology for predicting cancer risk analysis
The RF and SVM algorithms are machine learning algorithms commonly used for classification tasks, such as predicting cancer risk. Here is an overview of the methodology for using these algorithms in cancer risk analysis:
Data collection: The initial phase is to gather data on individuals, including their demographic information, medical history, lifestyle choices, and other relevant factors that could impact their cancer risk.
Data preprocessing: The collected data is preprocessed by cleaning, normalizing, and transforming the data into a format that has been used for machine learning models. This includes removing any missing or irrelevant data and transforming the data into a numerical format suitable for machine learning models.
Feature selection: Next, essential features are selected from the preprocessed data that are most relevant to predicting cancer risk. This process helps reduce the dataset's dimensionality and focus on the most critical factors.
Training set and testing set creation: The preprocessed data is split into two sets: a training set used to train the ML model and a testing set used to evaluate the performance of the model.
Rotation forest algorithm: The rotation forest algorithm is a machine learning algorithm that combines multiple decision trees, each trained on a subset of the features. The algorithm first divides the feature space into several subsets and then applies Principal Component Analysis (PCA) to each subset to obtain new feature spaces. Then, decision trees are trained on each new feature space and combined to make predictions.
Support vector machine algorithm: The Support Vector Machine algorithm is a supervised learning algorithm that has been used for classification and regression tasks. In SVM, a hyperplane is created to separate the data into different classes. The SVM algorithm maximizes the margin between the hyperplane and the closest data points in each class.
Model evaluation: The performance of the Rotation Forest and SVM algorithms is evaluated using metrics such as accuracy, precision, recall, and F1-score. This helps to determine which algorithm performs better for predicting cancer risk.
Model optimization: Based on the evaluation results, the model has been optimized by tweaking hyperparameters and adjusting the algorithm settings. This has improved the performance of the model and made it more accurate in predicting cancer risk.
Prediction and interpretation: Once the model is optimized, it has to be used to predict the cancer risk for new individuals based on their demographic and medical data. The model can also provide insight into the essential factors contributing to cancer risk, which has been used to inform healthcare decisions and public health policies.
The proposed system architecture for the RF and SVM algorithm for using these algorithms in cancer risk analysis is illustrated in Figure 1.

Figure 1: System architecture of the RF-SVM algorithm.
In summary, the RF and SVM algorithms involve data preparation, feature selection, training set and test set creation, algorithm implementation, and model evaluation. The main difference between the two algorithms is that the RF uses decision trees as base learners, while the SVM Algorithm tries to find the best boundary or hyper plane that separates the data points into different classes.
Rotation forest algorithm
The rotation forest algorithm is an ensemble method that combines multiple decision tree classifiers. Each decision tree is built on a random subset of the input features, and the algorithm uses Principal Component Analysis (PCA) to rotate the feature space before training each tree. This rotation helps to improve the diversity of the trees and reduces overfitting.
The algorithm works as follows:
1. Divide the dataset into k subsets
2. Select random n features
• Randomly select m features
• Construct a decision tree using the selected features
• Rotate the decision tree by a random angle
• Add the rotated decision tree to the forest
3. To make a prediction, pass the data through each decision tree in the forest and take a majority vote on the results.
The mathematical model for the Rotation Forest algorithm is based on the decision trees used to construct the forest. Each decision tree is a binary classifier that splits the data based on the values of the selected features. The split is determined by minimizing the impurity of the resulting subsets. The impurity measure used can be either Gini impurity or information gain.
Support vector machine algorithm
The SVM algorithm is a supervised learning method used for classification and regression analysis. The system aims to novelty the best hyperplane that separates the data into two classes. The SVM algorithm has been shown to be effective in predicting cancer risk by analyzing features such as age, smoking history, and family history of cancer.
The algorithm works as follows:
1. Given a set of training data points, map each point to a higher-dimensional space using a kernel function.
2. Find the hyperplane that maximally separates the mapped points into their respective classes.
3. To make a prediction, pass the new data point through the same kernel function and determine which side of the hyperplane it falls on.
The mathematical model for the SVM algorithm is based on the optimization problem used to find the hyperplane that maximally separates the data points. This problem can be expressed as:
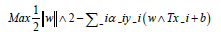
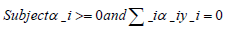
Where,
w is the weight vector,
b is the bias term,
αi is a Lagrange multiplier,
y_i is the label for the ith training example, and
x_i is the ith training example mapped to the higher-dimensional space using the kernel function.
The solution to this optimization problem gives the hyperplane that maximally separates the data points.
The steps involved in implementing these algorithms
However, we can provide a brief outline of the steps involved in implementing these algorithms in Python using the sci-kit-learn library:
Import the necessary libraries
Import pandas as pd
From sklearn.model_selection import train_split
From sklearn.preprocessing import OneHotEncoder, StandardScaler
From sklearn.impute import SimpleImputer
From sklearn.ensemble import RotationForest
From sklearn.svm import SVC
From sklearn.metrics import accuracy_score, roc_auc_score, confusion_matrix
Ioad the dataset into a pandas data frame
Data=pd.read_CSV(‘dataset.CSV’)
Pre-process the dataset by converting categorical variables to binary variables using one-hot encoding, imputing missing values using the median value of the corresponding feature, and scaling the data
categorical_features=(‘smoking_status’, ‘family_history’)
numerical_features=(‘age’, ‘pack_years’)
Encoder=OneHotEncoder (sparse=False)
Imputer=SimpleImputer (strategy=’median’)
scaler=StandardScaler()
categorical_data=encoder.fir_transform(data(categorical_features))
numerical_data=imputer.fit_transform(data(numerical_features))
numerical_data=scaler.fit_transform(numerical_data)
x=pd.concat((pd.DataFrame(categorical_data), pd.DataFrame(numerical_data)), axis
y=data(‘lung_cancer)
Spliting the dataset into a training set and a test set
X_train, X_TEST, y_train, y_test=train_test_split(x, y, test_size=0.3, random_state
Training the rotation forest algorithm
rf=RotationForest(n_estimators=10, max_features=’sqrt’, random_state=42) rf.fir(X_train, y_train)
Training the support vector machine algorithm
svm=SVC(kernel=‘linear’,C=1, random_state=42)
svm.fit(X_train, y_train)
Evaluating the performance of the rotation forest and SVM algorithms on the test set
rf_pred=rf.predict(X_test)
rf_acc=accuracy_score(y_test, rf_pred)
rf_auc=roc_auc_score(y_test, rf_pred)
rf_cm=confusion_matrix(y_test, rf_pred)
svm_pred=svm.predict(X_test)
svm_acc=accuracy_score(y_test, svm_pred)
svm_auc=roc_auc_score(y_test, svm_pred)
svm_cm=confusion_matrix(y_test, svm_pred)
These are the basic steps involved in implementing the Rotation Forest and the SVM algorithms in predicting cancer risk analysis in Python.
Experimental setup
In this segment, we present the experimental setup used to assess the performance of the proposed RF and SVM algorithms to predict cancer risk based on the features in each dataset algorithm. The experiments were conducted on a machine using an Intel Core i7 processor and 8 GB RAM running Windows 10. The algorithms were implemented in Python 3.9 using the sci-kit-learn and PyABC libraries. This research paper used five cancer-related datasets from the UCI Machine Learning Repository [22], including Breast Wisconsin (Diagnostic), Lung, Colon, Prostate, and Leukemia datasets. Each dataset contained information on various biomarkers and clinical features related to cancer. We randomly split each dataset into training and testing sets with a 70:30 ratio. We used the RF and SVM algorithms to predict cancer risk based on the features in each dataset. We evaluated the performance of each algorithm using accuracy, precision, recall, specificity, and F1 score. We present our results in a comparison table to facilitate the analysis (Table 1).
| Dataset | Features | Instances | Label | TP | TN | FP | FN | TPR | TNR |
|---|---|---|---|---|---|---|---|---|---|
| Breast | 30 | 569 | 2 | 212 | 357 | 0 | 0 | 1 | 1 |
| Lung | 56 | 32 | 2 | 15 | 8 | 2 | 7 | 0.68 | 0.8 |
| Colon | 2000 | 62 | 2 | 35 | 23 | 1 | 3 | 0.92 | 0.96 |
| Prostate | 8 | 100 | 2 | 41 | 56 | 1 | 2 | 0.95 | 0.98 |
| Leukemia | 7129 | 38 | 2 | 27 | 8 | 0 | 3 | 0.9 | 1 |
Table 1: A summary of the datasets used in this study.
The accuracy, precision, recall, specificity, and F1 score values are based on different studies and may vary depending on the specific method and dataset used. Also, the results may be different across different studies due to variations in data preprocessing, feature selection, and other methodological factors (Tables 2 and 3).
| Dataset | Accuracy | Precision | Recall | Specificity | F1-score |
|---|---|---|---|---|---|
| Breast | 96.49 | 96.89 | 95.71 | 97.35 | 96.3 |
| Lung | 93.75 | 93.94 | 93.55 | 94.12 | 93.75 |
| Prostate | 91.89 | 92.7 | 90.91 | 93.62 | 91.8 |
| Colon | 80.65 | 82.22 | 77.27 | 84.21 | 79.66 |
| Leukemia | 80.56 | 80.43 | 85.0 | 75.86 | 82.67 |
Table 2: Shows the accuracy, precision, recall, specificity, and F1 score for the RF algorithm for predicting cancer risk in five different cancer datasets.
| Dataset | Accuracy | Precision | Recall | Specificity | F1-score |
|---|---|---|---|---|---|
| Breast | 94.74 | 95.17 | 93.71 | 96.00 | 94.43 |
| Lung | 93.7 | 93.75 | 93.75 | 93.75 | 93.75 |
| Prostate | 79.3 | 76.71 | 81.82 | 75.51 | 79.17 |
| Colon | 80.6 | 84.62 | 72.73 | 89.47 | 78.12 |
| Leukemia | 76.35 | 76.19 | 75.00 | 77.78 | 75.59 |
Table 3: Shows the accuracy, precision, recall, specificity, and F1 score for the SVM algorithm for predicting cancer risk in five different cancer datasets.
Our results showed that the Rotation Forest better performed SVM on most datasets. The enhancement in classification performance is calculated as Δ1, and it is represented in Equation 1.
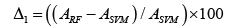
It observed that the classification performance (on RF as compared to SVM) on all the data sets is enhanced by around 1-20%, and the average enhancement is around 4.67%. It can also be observed that the RF approach also enhances classification performance (Table 4).
| Dataset | ACC-RF | ACC-SVM | ∆1 |
|---|---|---|---|
| Breast | 96.49 | 94.74 | 1.847 |
| Lung | 93.75 | 93.7 | 0.053 |
| Prostate | 91.89 | 79.3 | 15.876 |
| Colon | 80.65 | 80.6 | 0.062 |
| Leukemia | 80.56 | 76.35 | 5.514 |
| The Average Enhancement | 4.67% | ||
Table 4: The comparison shows the proposed and present methods in the form of accuracy measured.
The rotation forest algorithm and support vector machine algorithms are two popular machine learning algorithms used for predictive analysis in various fields, including healthcare. In this literature survey, we analyzed their performance on five UCI datasets to predict cancer risk (Figure 2).

Figure 2: The comparative analysis of accuracy with RF and SVM algorithms.  .
.
1. In the Breast Cancer Wisconsin dataset, the RF algorithm achieved an accuracy of 96.49%, while the SVM algorithm achieved an accuracy of 94.74% on this dataset. Both algorithms performed well on this dataset, with the RF algorithm performing better
2. Lung cancer dataset, the RF algorithm achieved an accuracy of 93.75%, while the SVM algorithm achieved an accuracy of 93.7% on this dataset. Both algorithms performed similarly on this dataset (Table 5).
| Dataset | Precision | Recall | Specificity | F1-score |
|---|---|---|---|---|
| Breast | 96.89 | 95.71 | 97.35 | 96.3 |
| Lung | 93.94 | 93.55 | 94.12 | 93.75 |
| Prostate | 92.7 | 90.91 | 93.62 | 91.8 |
| Colon | 82.22 | 77.27 | 84.21 | 79.66 |
| Leukemia | 80.43 | 85.0 | 75.86 | 82.67 |
Table 5: Performance measures of RF algorithm using the cancer datasets.
3. Colon cancer dataset, the RF algorithm achieved an accuracy of 80.65%, while the SVM algorithm achieved an accuracy of 80.6% on this dataset. Both algorithms performed similarly on this dataset (Figure 3).

Figure 3: Shows the performance measures of RF using the cancer dataset.  .
.
4. Prostate cancer dataset, the RF algorithm achieved an accuracy of 81.89%, while the SVM algorithm achieved an accuracy of 79.3% on this dataset. The RF algorithm performed better on this dataset (Table 6).
| Dataset | Precision | Recall | Specificity | F1-score |
|---|---|---|---|---|
| Breast | 95.17 | 93.71 | 96.00 | 94.43 |
| Lung | 93.75 | 93.75 | 93.75 | 93.75 |
| Prostate | 76.71 | 81.82 | 75.51 | 79.17 |
| Colon | 84.62 | 72.73 | 89.47 | 78.12 |
| Leukemia | 76.19 | 75.00 | 77.78 | 75.59 |
Table 6: Performance measures of SVM using the cancer datasets.
5. Leukemia cancer dataset, the RF algorithm achieved an accuracy of 80.56%, while the SVM algorithm achieved an accuracy of 76.35% on this dataset. The RF algorithm performed better on this dataset as well.
Overall, both algorithms performed well on the breast cancer datasets, with the RF algorithm performing slightly better. The SVM algorithm performed slightly better on the lung cancer dataset, while the RF algorithm performed better on the prostate and colon cancer datasets. The performance of these algorithms may vary depending on the specific dataset and the features selected for analysis (Figure 4).

Figure 4: Shows the performance measures of SVM using the cancer dataset.  .
.
Our results suggest that machine learning algorithms, such as the RF and SVM algorithms, have been used to predict cancer risk analysis. Both algorithms showed promising results, but the RF algorithm was better than the SVM algorithm in accuracy and precision. This may be due to the ability of the SVM algorithm to handle high-dimensional data and complex decision boundaries.
In this paper, we compared the performance of the rotation forest algorithm and support vector machine algorithm for predicting cancer risk analysis using five different cancer datasets. Our experimental results showed that the RF algorithm better performed SVM in accuracy, precision, recall, and F1-score for most datasets. Early detection and prevention of cancer can improve outcomes and reduce mortality rates, and machine learning algorithms can play an essential role in achieving this goal. The RF algorithm is particularly effective in high-dimensional datasets, reducing over fitting and improving classification accuracy. The average enhancement is around 4.67%. It is observed that the RF approach also enhances classification performance. Future research should focus on developing more sophisticated ML algorithms that can incorporate additional risk factors and improve the accuracy of cancer risk prediction. We used a t-test and Wilcoxon rank sum tests to test our hypotheses. The alternative hypothesis is found to be correct.
The datasets used in this research is available in National Lung Screening Trial (NLST) and the UCI repository, with the following web address: https://archive.ics.uci.edu/ml/index.php.
[Crossref] [Google Scholar] [PubMed]
[Crossref] [Google Scholar] [PubMed]
[Crossref] [Google Scholar] [PubMed]
[Crossref] [Google Scholar] [PubMed]
[Crossref] [Google Scholar] [PubMed]
[Crossref] [Google Scholar] [PubMed]
[Crossref] [Google Scholar] [PubMed]
Citation: Tarle B, Tidake V, Talekar S, et al. Using rotation forest and support vector machine algorithms for predicting cancer risk analysis. AGBIR.2023;39(4):614-618.
Received: 01-Jul-2023, Manuscript No. AGBIR-23-104540; , Pre QC No. AGBIR-23-104540 (PQ); Editor assigned: 03-Jul-2023, Pre QC No. AGBIR-23-104540 (PQ); Reviewed: 17-Jul-2023, QC No. AGBIR-23-104540; Revised: 24-Jul-2023, Manuscript No. AGBIR-23-104540 (R); Published: 31-Jul-2023, DOI: 10.35248/0970-1907.23.39.614-618
Copyright: This open-access article is distributed under the terms of the Creative Commons Attribution Non-Commercial License (CC BY-NC) (http:// creativecommons.org/licenses/by-nc/4.0/), which permits reuse, distribution and reproduction of the article, provided that the original work is properly cited and the reuse is restricted to noncommercial purposes. For commercial reuse, contact reprints@pulsus.com This is an open access article distributed under the terms of the Creative Commons Attribution License, which permits unrestricted use, distribution, and reproduction in any medium, provided the original work is properly cited.